

Real Assets
De-Dollarization: More Countries Seek Alternatives to the U.S. Dollar
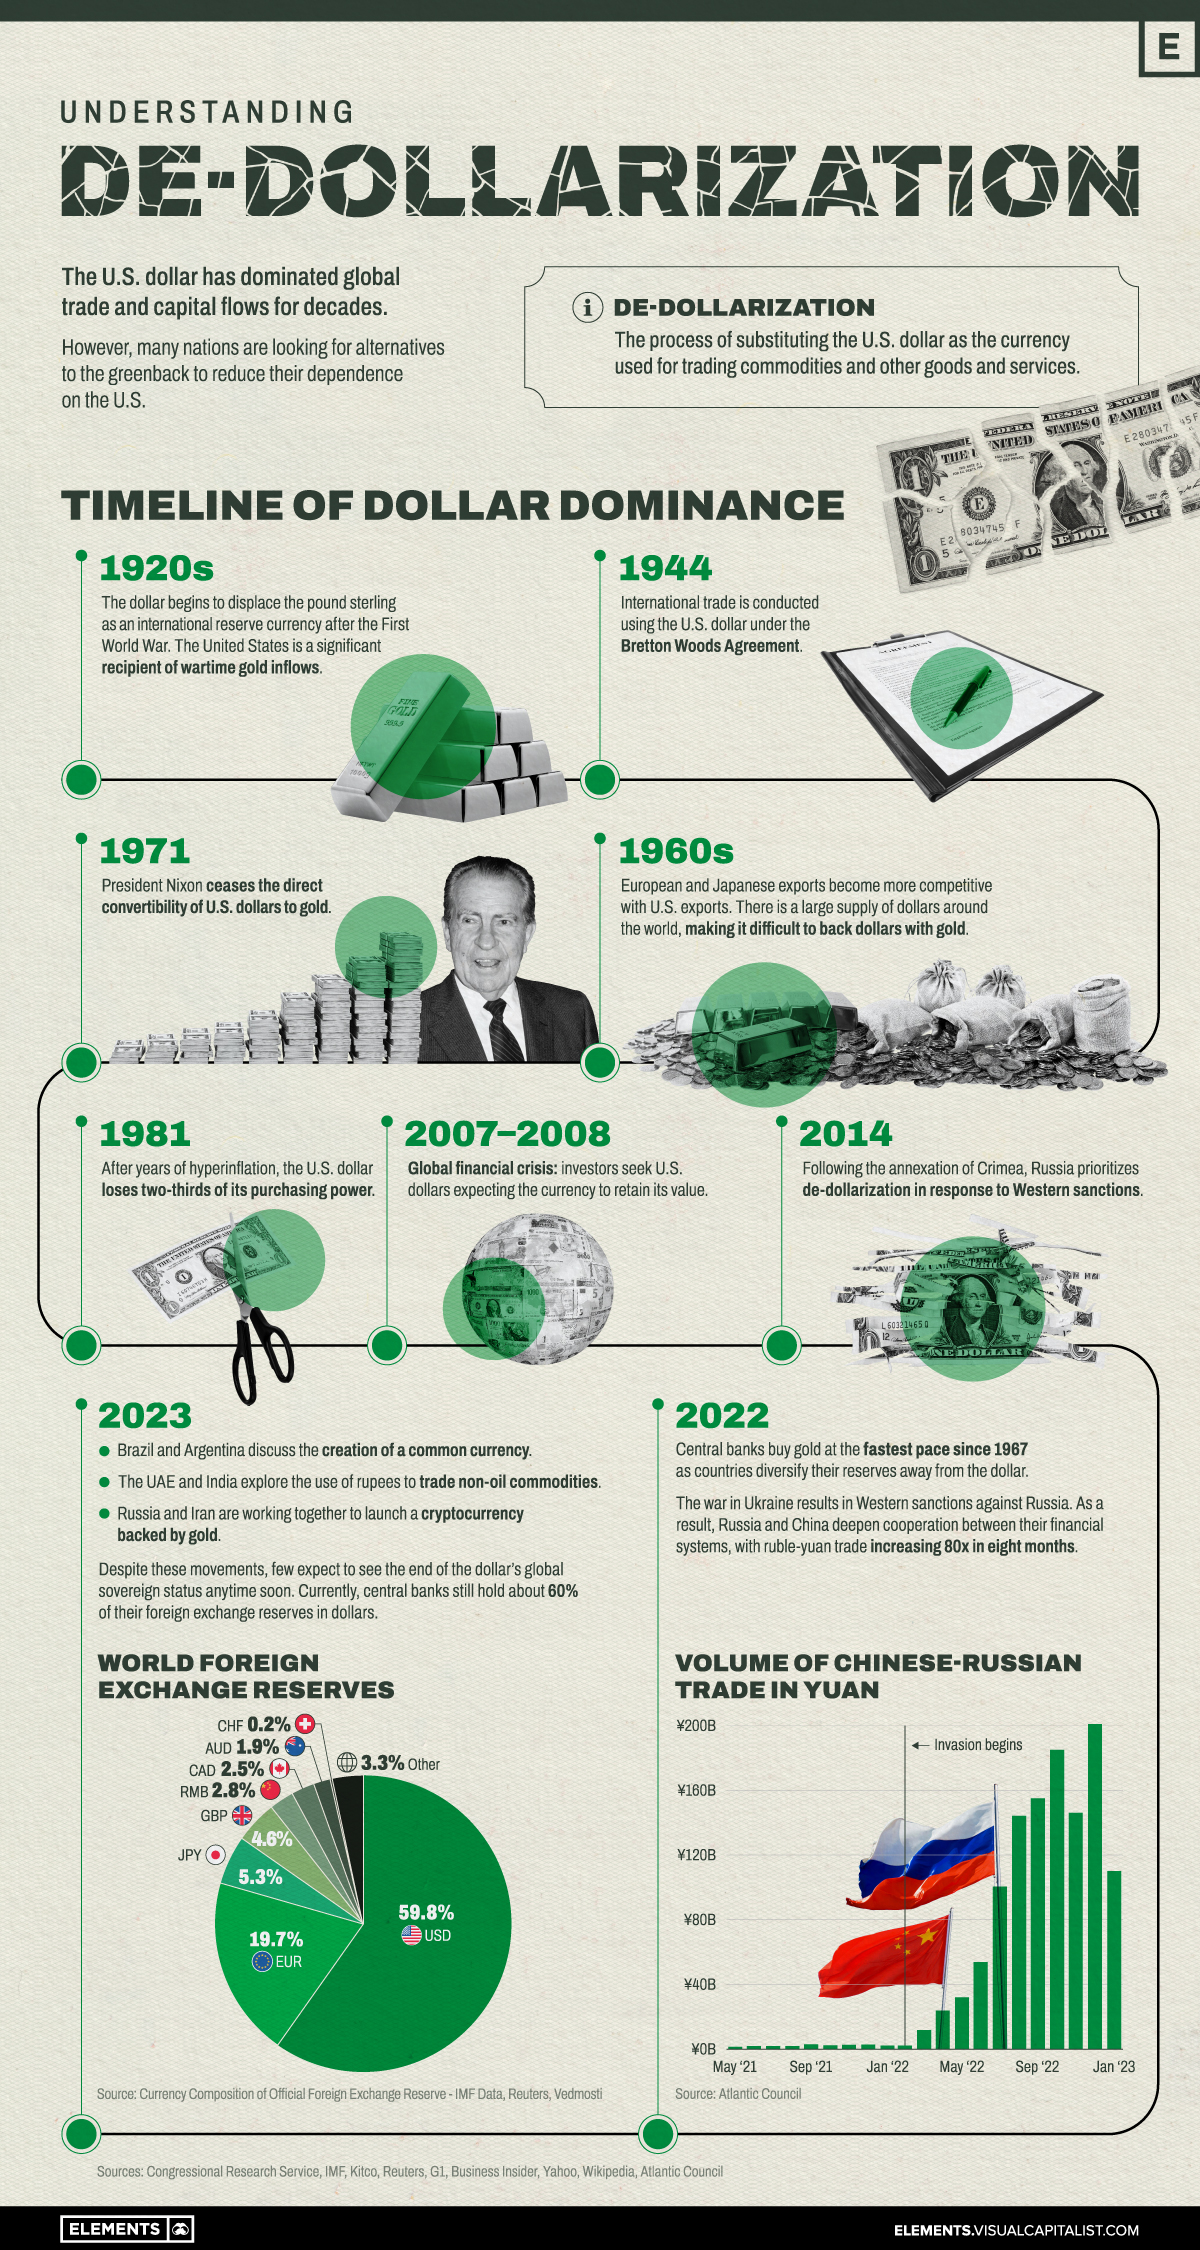
De-Dollarization: More Countries Seek Alternatives to the U.S. Dollar
The U.S. dollar has dominated global trade and capital flows over many decades.
However, many nations are looking for alternatives to the greenback to reduce their dependence on the United States.
This graphic catalogs the rise of the U.S. dollar as the dominant international reserve currency, and the recent efforts by various nations to de-dollarize and reduce their dependence on the U.S. financial system.
The Dollar Dominance
The United States became, almost overnight, the leading financial power after World War I. The country entered the war only in 1917 and emerged far stronger than its European counterparts.
As a result, the dollar began to displace the pound sterling as the international reserve currency and the U.S. also became a significant recipient of wartime gold inflows.
The dollar then gained a greater role in 1944, when 44 countries signed the Bretton Woods Agreement, creating a collective international currency exchange regime pegged to the U.S. dollar which was, in turn, pegged to the price of gold.
By the late 1960s, European and Japanese exports became more competitive with U.S. exports. There was a large supply of dollars around the world, making it difficult to back dollars with gold. President Nixon ceased the direct convertibility of U.S. dollars to gold in 1971. This ended both the gold standard and the limit on the amount of currency that could be printed.
Although it has remained the international reserve currency, the U.S. dollar has increasingly lost its purchasing power since then.
Russia and China’s Steps Towards De-Dollarization
Concerned about America’s dominance over the global financial system and the country’s ability to ‘weaponize’ it, other nations have been testing alternatives to reduce the dollar’s hegemony.
As the United States and other Western nations imposed economic sanctions against Russia in response to its invasion of Ukraine, Moscow and the Chinese government have been teaming up to reduce reliance on the dollar and to establish cooperation between their financial systems.
Since the invasion in 2022, the ruble-yuan trade has increased eighty-fold. Russia and Iran are also working together to launch a cryptocurrency backed by gold, according to Russian news agency Vedmosti.
In addition, central banks (especially Russia’s and China’s) have bought gold at the fastest pace since 1967 as countries move to diversify their reserves away from the dollar.
How Other Countries are Reducing Dollar Dependence
De-dollarization it’s a theme in other parts of the world:
- In recent months, Brazil and Argentina have discussed the creation of a common currency for the two largest economies in South America.
- In a conference in Singapore in January, multiple former Southeast Asian officials spoke about de-dollarization efforts underway.
- The UAE and India are in talks to use rupees to trade non-oil commodities in a shift away from the dollar, according to Reuters.
- For the first time in 48 years, Saudi Arabia said that the oil-rich nation is open to trading in currencies besides the U.S. dollar.
Despite these movements, few expect to see the end of the dollar’s global sovereign status anytime soon. Currently, central banks still hold about 60% of their foreign exchange reserves in dollars.


Real Assets
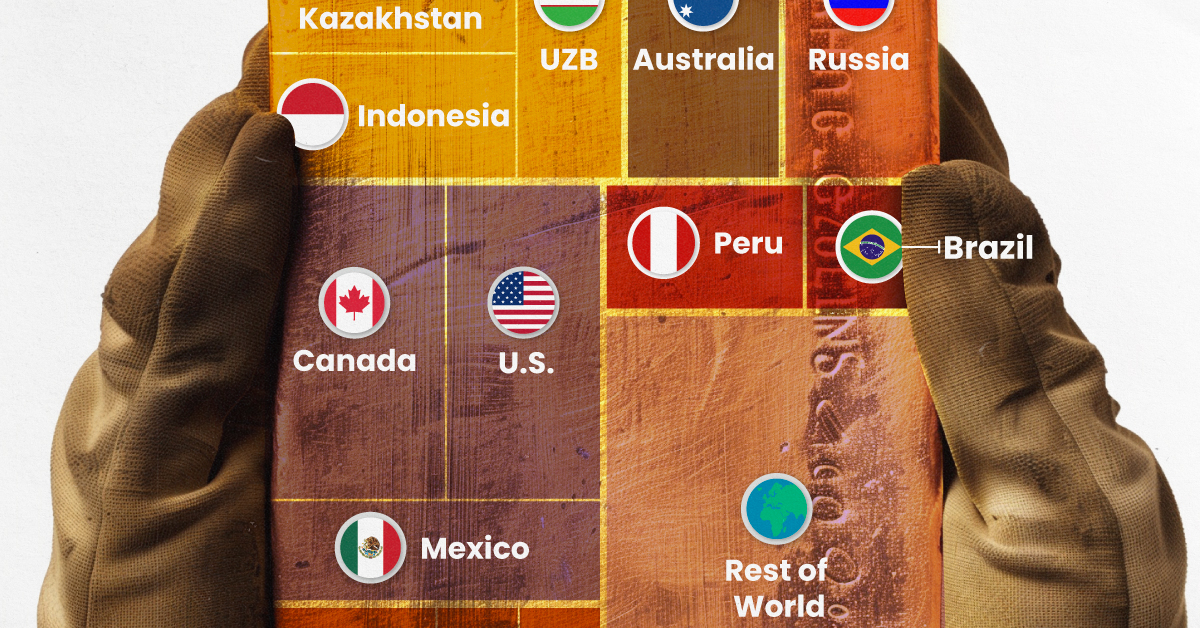
Visualizing Global Gold Production in 2023
Gold production in 2023 was led by China, Australia, and Russia, with each outputting over 300 tonnes.
Visualizing Global Gold Production in 2023
This was originally posted on our Voronoi app. Download the app for free on iOS or Android and discover incredible data-driven charts from a variety of trusted sources.
Over 3,000 tonnes of gold were produced globally in 2023.
In this graphic, we list the world’s leading countries in terms of gold production. These figures come from the latest USGS publication on gold statistics (published January 2024).
China, Australia, and Russia Produced the Most Gold in 2023
China was the top producer in 2023, responsible for over 12% of total global production, followed by Australia and Russia.
| Country | Region | 2023E Production (tonnes) |
|---|---|---|
| 🇨🇳 China | Asia | 370 |
| 🇦🇺 Australia | Oceania | 310 |
| 🇷🇺 Russia | Europe | 310 |
| 🇨🇦 Canada | North America | 200 |
| 🇺🇸 United States | North America | 170 |
| 🇰🇿 Kazakhstan | Asia | 130 |
| 🇲🇽 Mexico | North America | 120 |
| 🇮🇩 Indonesia | Asia | 110 |
| 🇿🇦 South Africa | Africa | 100 |
| 🇺🇿 Uzbekistan | Asia | 100 |
| 🇬🇭 Ghana | Africa | 90 |
| 🇵🇪 Peru | South America | 90 |
| 🇧🇷 Brazil | South America | 60 |
| 🇧🇫 Burkina Faso | Africa | 60 |
| 🇲🇱 Mali | Africa | 60 |
| 🇹🇿 Tanzania | Africa | 60 |
| 🌍 Rest of World | - | 700 |
Gold mines in China are primarily concentrated in eastern provinces such as Shandong, Henan, Fujian, and Liaoning. As of January 2024, China’s gold mine reserves stand at an estimated 3,000 tonnes, representing around 5% of the global total of 59,000 tonnes.
In addition to being the top producer, China emerged as the largest buyer of the yellow metal for the year. In fact, the country’s central bank alone bought 225 tonnes of gold in 2023, according the World Gold Council.
Estimated Global Gold Consumption
Most of the gold produced in 2023 was used in jewelry production, while another significant portion was sold as a store of value, such as in gold bars or coins.
- Jewelry: 46%
- Central Banks and Institutions: 23%
- Physical Bars: 16%
- Official Coins, Medals, and Imitation Coins: 9%
- Electrical and Electronics: 5%
- Other: 1%
According to Fitch Solutions, over the medium term (2023-2032), global gold mine production is expected to grow 15%, as high prices encourage investment and output.
Real Assets
Charted: The Value Gap Between the Gold Price and Gold Miners
While gold prices hit all-time highs, gold mining stocks have lagged far behind.

Gold Price vs. Gold Mining Stocks
This was originally posted on our Voronoi app. Download the app for free on Apple or Android and discover incredible data-driven charts from a variety of trusted sources.
Although the price of gold has reached new record highs in 2024, gold miners are still far from their 2011 peaks.
In this graphic, we illustrate the evolution of gold prices since 2000 compared to the NYSE Arca Gold BUGS Index (HUI), which consists of the largest and most widely held public gold production companies. The data was compiled by Incrementum AG.
Mining Stocks Lag Far Behind
In April 2024, gold reached a new record high as Federal Reserve Chair Jerome Powell signaled policymakers may delay interest rate cuts until clearer signs of declining inflation materialize.
Additionally, with elections occurring in more than 60 countries in 2024 and ongoing conflicts in Ukraine and Gaza, central banks are continuing to buy gold to strengthen their reserves, creating momentum for the metal.
Traditionally known as a hedge against inflation and a safe haven during times of political and economic uncertainty, gold has climbed over 11% so far this year.
According to Business Insider, gold miners experienced their best performance in a year in March 2024. During that month, the gold mining sector outperformed all other U.S. industries, surpassing even the performance of semiconductor stocks.
Still, physical gold has outperformed shares of gold-mining companies over the past three years by one of the largest margins in decades.
| Year | Gold Price | NYSE Arca Gold BUGS Index (HUI) |
|---|---|---|
| 2023 | $2,062.92 | $243.31 |
| 2022 | $1,824.32 | $229.75 |
| 2021 | $1,828.60 | $258.87 |
| 2020 | $1,895.10 | $299.64 |
| 2019 | $1,523.00 | $241.94 |
| 2018 | $1,281.65 | $160.58 |
| 2017 | $1,296.50 | $192.31 |
| 2016 | $1,151.70 | $182.31 |
| 2015 | $1,060.20 | $111.18 |
| 2014 | $1,199.25 | $164.03 |
| 2013 | $1,201.50 | $197.70 |
| 2012 | $1,664.00 | $444.22 |
| 2011 | $1,574.50 | $498.73 |
| 2010 | $1,410.25 | $573.32 |
| 2009 | $1,104.00 | $429.91 |
| 2008 | $865.00 | $302.41 |
| 2007 | $836.50 | $409.37 |
| 2006 | $635.70 | $338.24 |
| 2005 | $513.00 | $276.90 |
| 2004 | $438.00 | $215.33 |
| 2003 | $417.25 | $242.93 |
| 2002 | $342.75 | $145.12 |
| 2001 | $276.50 | $65.20 |
| 2000 | $272.65 | $40.97 |
Among the largest companies on the NYSE Arca Gold BUGS Index, Colorado-based Newmont has experienced a 24% drop in its share price over the past year. Similarly, Canadian Barrick Gold also saw a decline of 6.5% over the past 12 months.

-

 Electrification3 years ago
Ranked: The Top 10 EV Battery Manufacturers
-

 Electrification2 years ago
The Key Minerals in an EV Battery
-

 Real Assets3 years ago
The World’s Top 10 Gold Mining Companies
-

 Misc3 years ago
All the Metals We Mined in One Visualization
-

 Energy Shift2 years ago
What Are the Five Major Types of Renewable Energy?
-

 Electrification2 years ago
Mapped: Solar Power by Country in 2021
-

 Electrification2 years ago
The World’s Largest Nickel Mining Companies
-

 Electrification3 years ago
How Much Land is Needed to Power the U.S. with Solar?