


Gold Price Outlook:
- Gold price’s rally has been impressive, but is now facing its first true test as US Treasury yields and the US Dollar (via the DXY Index) are rebounding.
- ‘Good news is bad news’ and vice-versa for gold prices as it pertains to the July US nonfarm payrolls report.
- According to the IG Client Sentiment Index, gold prices have a bullish bias in the near-term.

First Hurdles Appear
After a sharp rally over the past week, gold prices have reached their first obstacles, both fundamental and technical. On the fundamental side, a smattering of commentary from typically-dovish Federal Reserve officials have pushed up US Treasury yields, and in turn, the US Dollar (via the DXY Index). The incoming July US nonfarm payrolls report could be a make-or-break moment in the short-term for gold prices, though.
A strong US jobs report pushes up Fed rate hike odds and thus US Treasury yields, sparking a rebound in US real yields, which would be a negative development for gold prices. On the other hand, a weaker US jobs report could weigh on Fed rate hike odds and US Treasury yields, allowing US real yields to pullback and give gold prices a boost. In a sense, ‘good news is bad news’ and ‘bad news is good news’ for gold prices.
Gold Volatility Steady Near June Lows
Historically, gold prices have a relationship with volatility unlike other asset classes. While other asset classes like bonds and stocks don’t like increased volatility – signaling greater uncertainty around cash flows, dividends, coupon payments, etc. – gold tends to benefit during periods of higher volatility. It’s still difficult to read too much into the shifts in gold volatility now that a new fundamental regime is forming in the wake of the July Fed meeting.
GVZ (Gold Volatility) Technical Analysis: Daily Price Chart (August 2021 to August 2022) (Chart 1)

Gold volatility (as measured by the Cboe’s gold volatility ETF, GVZ, which tracks the 1-month implied volatility of gold as derived from the GLD option chain) was trading at 16.81 at the time this report was written. The 5-day correlation between GVZ and gold prices is +0.11 while the 20-day correlation is -0.77. One week ago, on July 28, the 5-day correlation was -0.76 and the 20-day correlation was +0.22.
Gold Price Rate Technical Analysis: Daily Chart (August 2021 to August 2022) (Chart 2)

Last week it was noted that “the technical picture for gold prices is rapidly improving…a return back to 1800 in the coming sessions is not out of the question – which would bring gold prices back to the descending trendline from the March and April swing highs.” That’s exactly where gold prices find themselves today, having arrived at their first major technical hurdle.
The momentum profile continues to improve. Gold prices are trading through above their daily 5-, 8-, 13-, and 21-EMA envelope, which is now in bullish sequential order. Daily MACD is rising albeit still below its signal line, while daily Slow Stochastics are holding in overbought territory. The July US NFP report could help catalyze a short-term reversal back under 1760 or a breakout towards 1832 in the coming sessions.
Gold Price Technical Analysis: Weekly Chart (October 2015 to August 2022) (Chart 3)
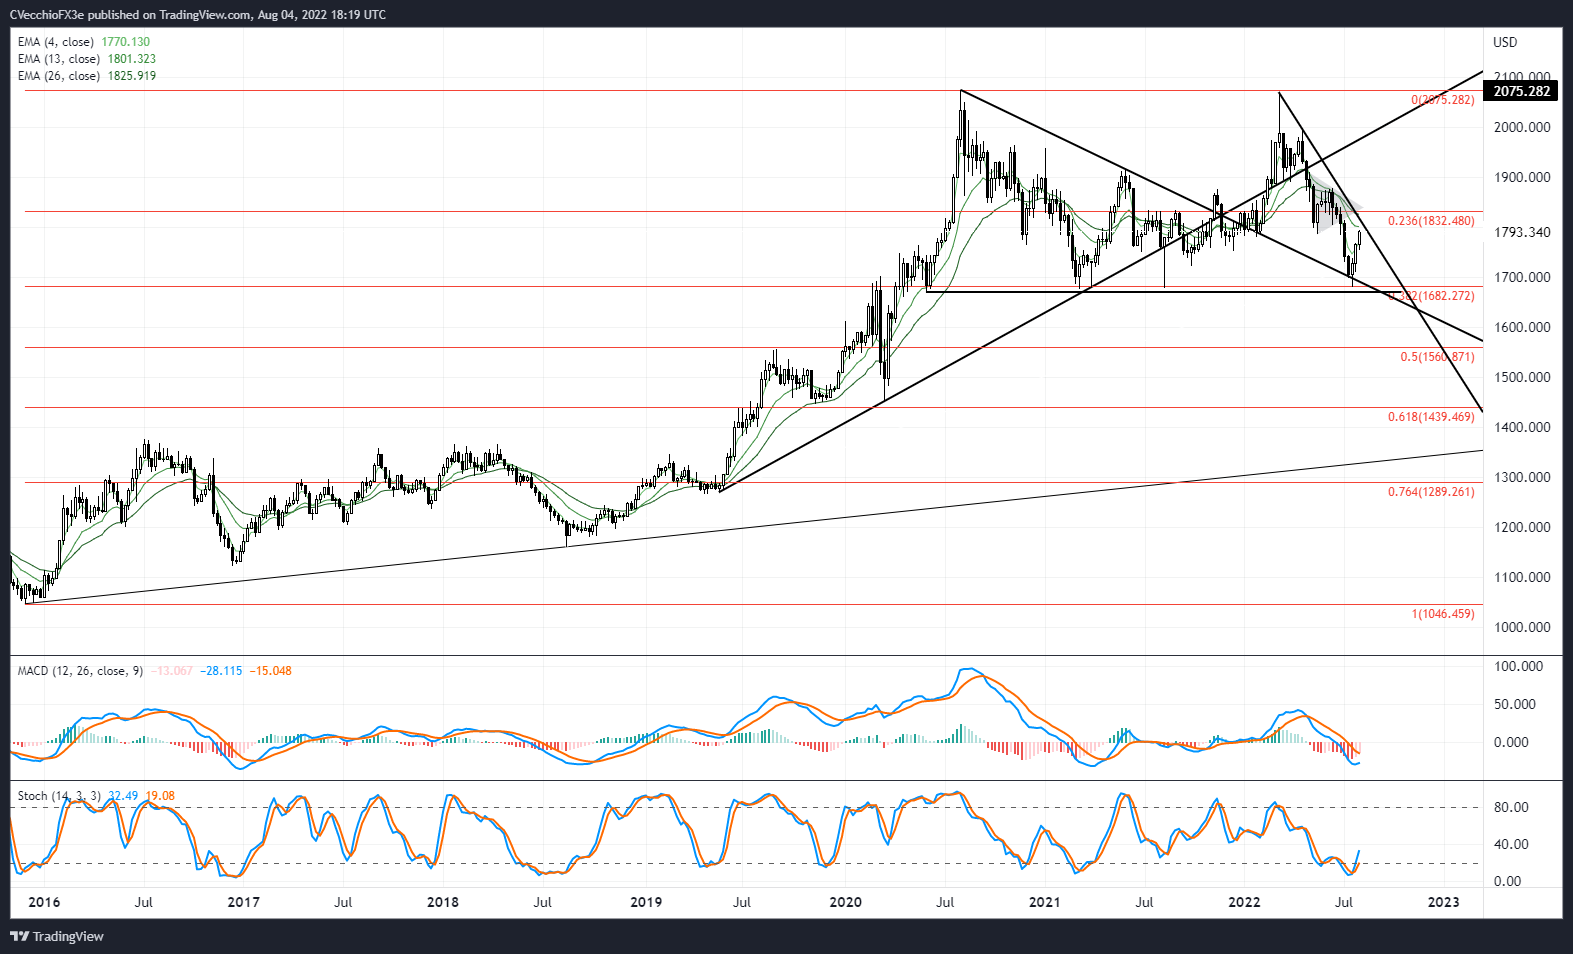
Nothing has changed: “a double top remains in place, but a quadruple bottom around 1680 warrants a reconsideration: a massive sideways range between 1680 and 2075 may have formed. A bounce from 1680 sees 1800 as the first area before resistance is found. The sudden shift in the environment suggests that the daily timeframe (and lower, like the 4-hour timeframe) will be better suited to pay attention to over the coming days/weeks as it will take a long time for technical indicators to evolve on the weekly timeframe.”

IG CLIENT SENTIMENT INDEX: GOLD PRICE FORECAST (August 4, 2022) (Chart 4)
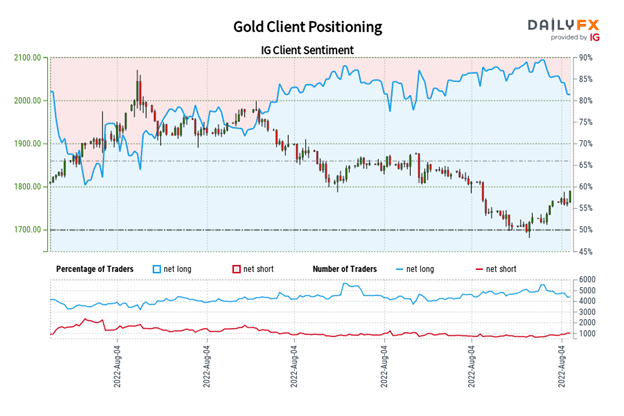
Gold: Retail trader data shows 79.37% of traders are net-long with the ratio of traders long to short at 3.85 to 1. The number of traders net-long is 4.76% lower than yesterday and 16.42% lower from last week, while the number of traders net-short is 6.75% higher than yesterday and 35.70% higher from last week.
We typically take a contrarian view to crowd sentiment, and the fact traders are net-long suggests Gold prices may continue to fall.
Yet traders are less net-long than yesterday and compared with last week. Recent changes in sentiment warn that the current Gold price trend may soon reverse higher despite the fact traders remain net-long.
Trade Smarter - Sign up for the DailyFX Newsletter
Receive timely and compelling market commentary from the DailyFX team
--- Written by Christopher Vecchio, CFA, Senior Strategist


