
Advertisement
Advertisement
Gold Price Futures (GC) Technical Analysis – Weakens as Dollar Firms on Powell’s Hawkish Testimony
By:
Gold lost its luster after Powell reiterated more aggressive monetary tightening to tame inflation, even at the expense of putting growth at risk.
In this article:
Gold futures are edging lower late in the session on Thursday as the U.S. Dollar firmed following hawkish comments from U.S. Federal Chairman Jerome Powell.
Gold lost its luster after Powell reiterated more aggressive monetary tightening to tame inflation, even at the expense of putting economic growth at risk. Losses were likely limited by a plunge in U.S. Treasury yields, following the release of weaker-than-expected economic data.
At 17:28 GMT, August Comex gold futures are trading $1829.70, down $8.70 or -0.47%. The SPDR Gold Shares ETF (GLD) is at $170.43, down $0.88 or -0.52%.
Powell Boosts the Dollar, While Weak PMIs Sink Treasury Yields
Powell told the House Finance Committee that the Fed’s commitment to curbing inflation was ‘unconditional’.
Meanwhile, U.S. business activity slowed considerably in June as high inflation and decline consumer confidence dampened demand across the board, resulting in a gauge of new orders contracting for the first time in nearly two years.
Flash Manufacturing PMI decreased to 52.4 from 57.0 in May. Economists polled by Reuters had forecast the index would slip to 56.0. The Flash Services Sector PMI dropped to a reading of 51.6 from 53.4 in May. Economists were looking for a slight rise to 53.9.
Treasury yields plunged after the reports were released at 13:45 GMT, but gold traders shrugged off the news.
Daily Swing Chart Technical Analysis
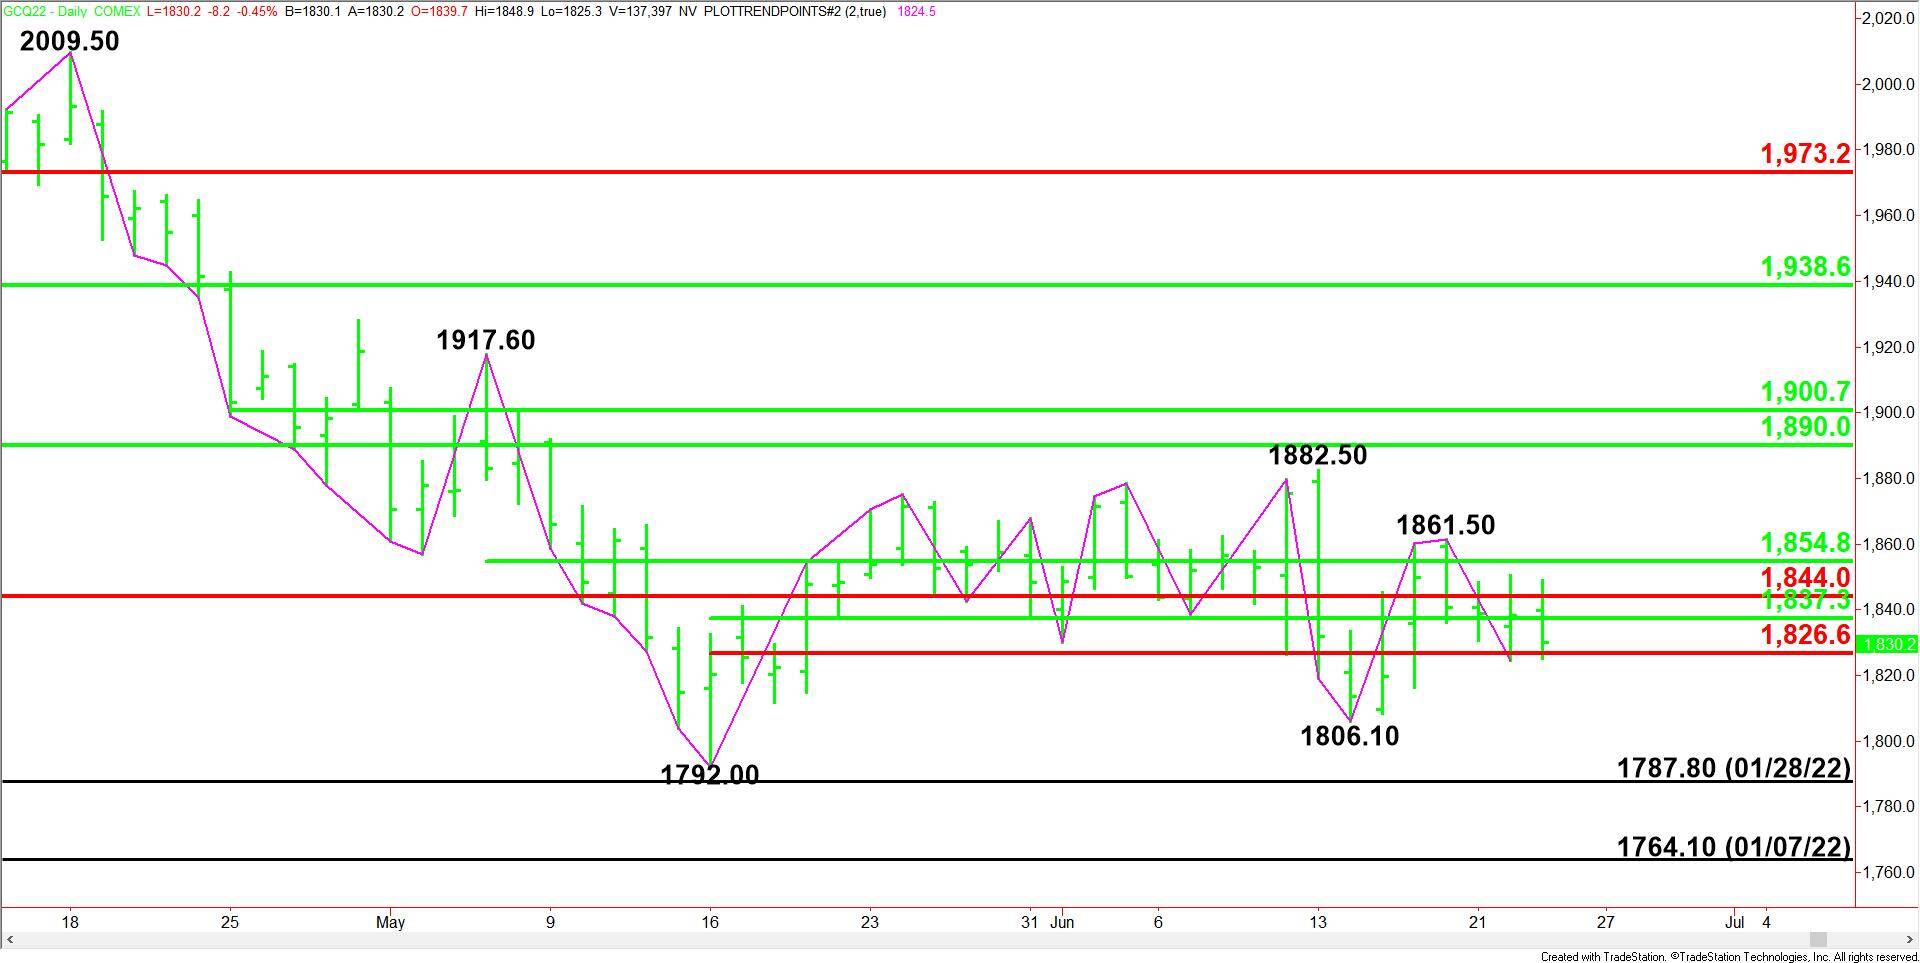
The main trend is down according to the daily swing chart. A trade through $1806.10 will signal a resumption of the downtrend. A move through $1861.50 will change the main trend to up.
On the downside, the nearest support is a short-term Fibonacci level at $1826.60. On the upside, resistance is layered at $1837.30, $1844.00 and $1854.80.
The long-term Fibonacci level at $1844.00 is controlling the direction of the market.
Daily Swing Chart Technical Forecast
Trader reaction to the short-term Fibonacci level at $1826.60 is likely to determine the direction of the August Comex gold market into the close on Thursday.
Bearish Scenario
A sustained move under $1826.60 will indicate the presence of sellers. This could trigger a late session acceleration into the nearest main bottom at $1806.10.
Bullish Scenario
A sustained move over $1826.60 will signal the presence of buyers. However, this is likely to lead to a labored rally all the way up to the nearest main top at $1861.50.
Taking out $1861.50 will change the main trend to up and could trigger an acceleration into the next main top at $1882.50.
For a look at all of today’s economic events, check out our economic calendar.
About the Author
James Hyerczykauthor
James is a Florida-based technical analyst, market researcher, educator and trader with 35+ years of experience. He is an expert in the area of patterns, price and time analysis as it applies to futures, Forex, and stocks.
Did you find this article useful?
Latest news and analysis


Advertisement