-
Gold, Chart of the Week: Bearish confluences below $1,830
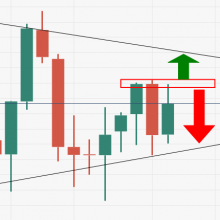
Gold can be analysed from a bearish perspective as per the following top-down analysis. This rhymes with the hawkish signals coming from the Federal Reserve and the market expectations suggesting a March Fed funds hike is imminent. Investors have extended short positioning and sold longs with yields across the curve moved convincingly higher. chart The monthly W-formation is a bearish reversion pattern where the neckline comes in at $1,783 with a confluence of the dynamic support line. Gold weekly chart: chart The weekly chart is showing that gold is struggling to break the prior double highs and a failure again ... (full story)
- Story Stats
- Posted: Jan 16, 2022 11:39pm
- Submitted by:Category: Technical AnalysisComments: 0 / Views: 354