


Gold Technical Price Outlook: XAU/USD Near-term Trade Levels
- Gold price updated technical trade levels – Daily & Intraday Charts
- XAU/USD carves well-defined monthly opening range below resistance- breakout pending
- New to Gold Trading? Get started with this Free How to Trade Gold -Beginners Guide
Gold prices surged into the start of the week with XAU/USD up more than 1.4% in early US trade on Wednesday. The recovery is now approaching major resistance into the 20202 yearly open and the focus is on this post- inflation push toward the highs. While the broader outlook remains constructive, the immediate advance may be vulnerable into this region and we’re looking for possible price inflection for guidance in the days ahead. These are the updated targets and invalidation levels that matter on the XAU/USD technical charts heading into the close of the week. Review my latest Strategy Webinar for an in-depth breakdown of this gold technical setup and more.
Gold Price Chart - XAU/USD Daily
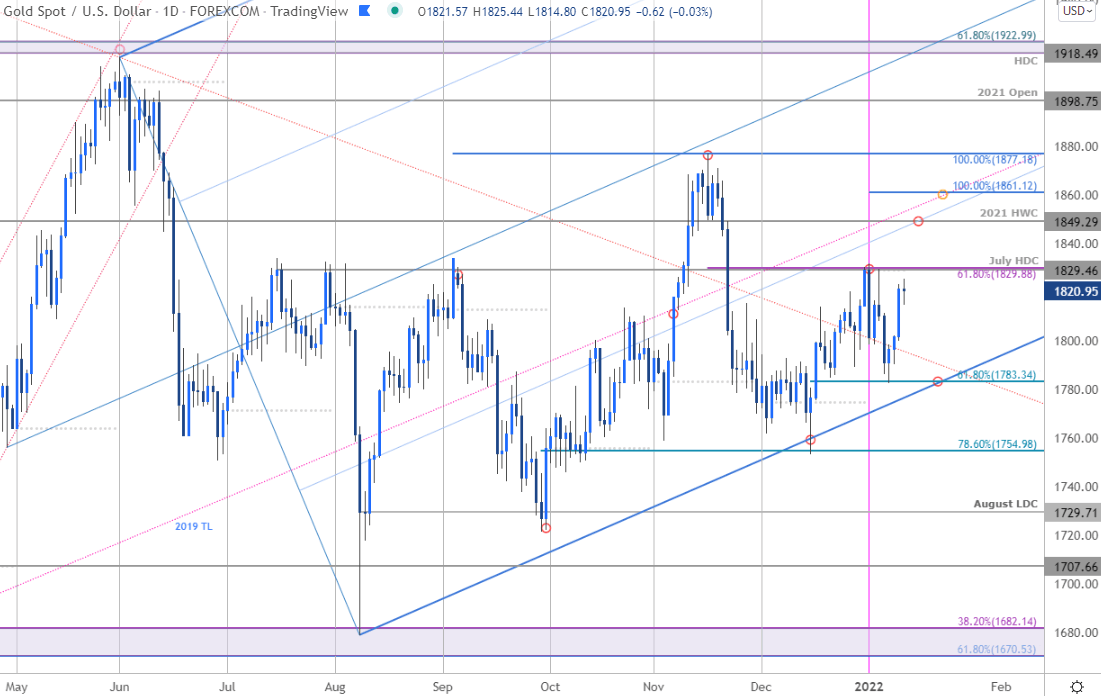
Chart Prepared by Michael Boutros, Technical Strategist; Gold on Tradingview
Technical Outlook: Gold prices opened the year at confluent resistance- 1829 is defined by the July high-day close and the 61.8% Fibonacci retracement of the November decline. This threshold was tested on January 5th and now also represents the monthly opening-range high. Daily support rests with the 61.8% retracement of the December rally at 1783 – as we noted last week, the focus remains on a breakout of this range for guidance in the days ahead.
Gold Price Chart - XAU/USD 120min
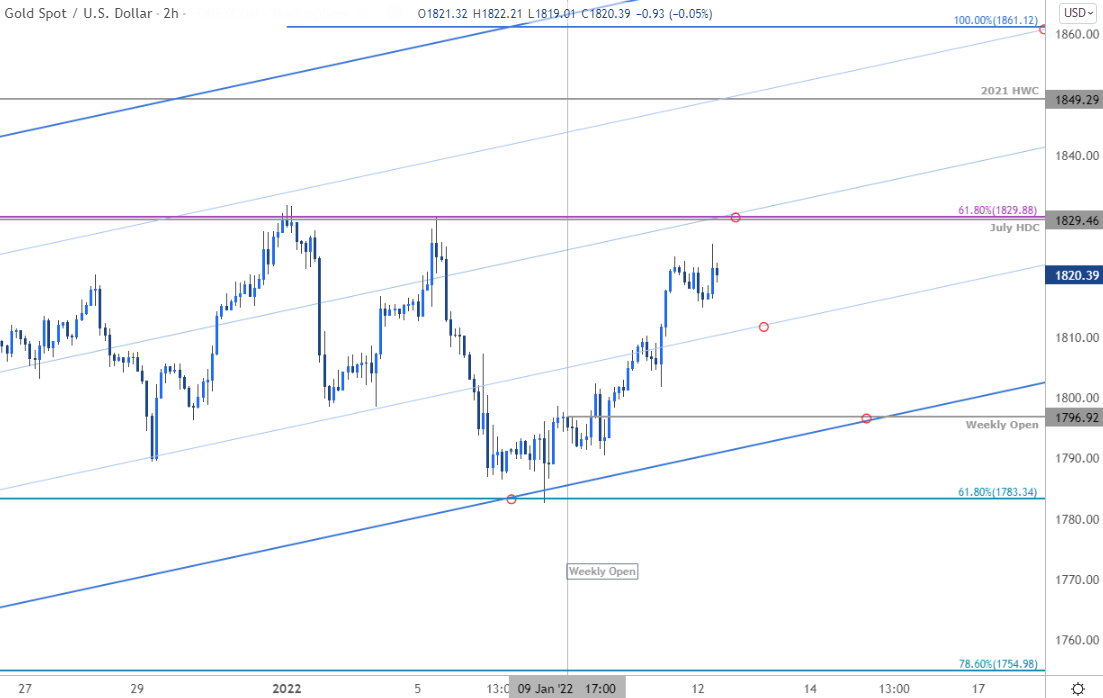
Notes: A closer look at Gold price action shows XAU/USD trading within the confines of an ascending pitchfork formation extending off the November / December low. The recovery off the lower parallel is now approaching resistance once again at 1829- look for a reaction there IF reached. A topside breach / close above the median-line is needed to validate a breakout of the monthly opening-range with such a scenario exposing subsequent resistance objectives at 1849 (2021 high-week close) and the 100% extension of the December advance at 1861. Initial support rests with the 25% parallel (currently ~1812) with near-term bullish invalidation nor raised to the weekly open at 1796. Keep in mind that a close below this formation could fuel a bout of accelerated losses for gold towards 1754 .

Bottom line: The immediate focus is on this approach towards the monthly range-highs and we’re looking for a breakout of the January range for direction. From a trading standpoint, look to reduce long-exposure / raise protective stops on a stretch towards 1829 – pullbacks should be limited to the weekly open IF price is heading higher on this stretch. Review my latest Gold Weekly Price Outlook for a closer look at the longer-term XAU/USD technical trading levels.
For a complete breakdown of Michael’s trading strategy, review his Foundations of Technical Analysis series on Building a Trading Strategy
Gold Trader Sentiment – XAU/USD Price Chart
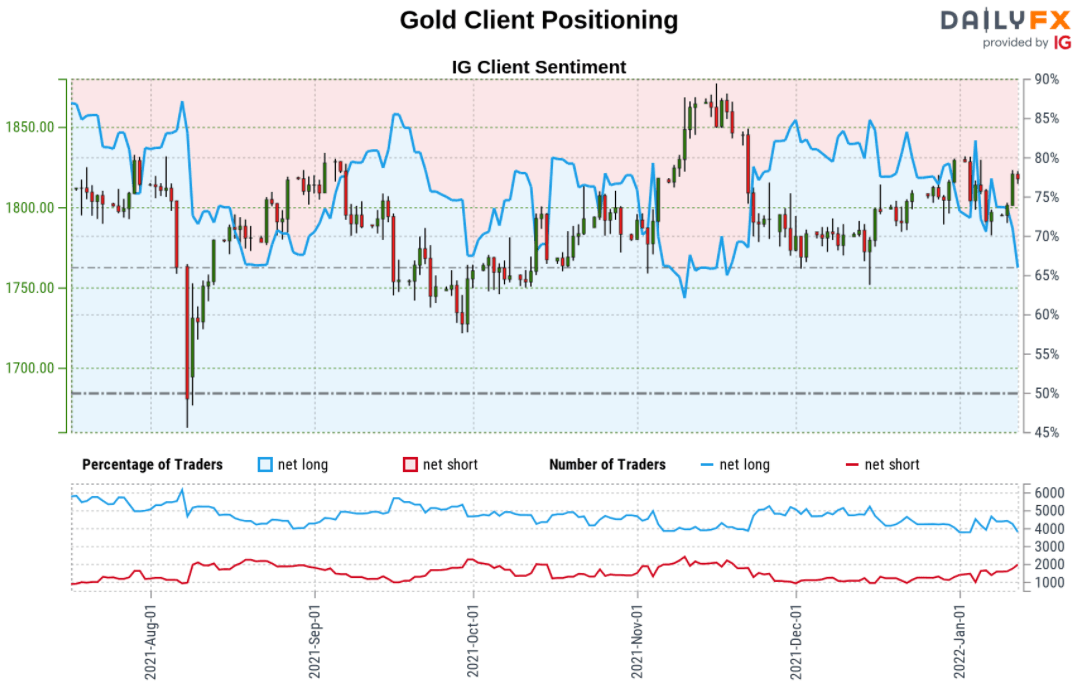
- A summary of IG Client Sentiment shows traders are net-long Gold- the ratio stands at +1.87 (65.18% of traders are long) – typically bearishreading
- Long positions are5.42% lower than yesterday and 10.29% lower from last week
- Short positions are12.95% higher than yesterday and 21.52% higher from last week
- We typically take a contrarian view to crowd sentiment, and the fact traders are net-long suggests Gold prices may continue to fall. Yet traders are less net-long than yesterday and compared with last week. Recent changes in sentiment warn that the current Gold price trend may soon reverse higher despite the fact traders remain net-long.
| Change in | Longs | Shorts | OI |
| Daily | 3% | -5% | -1% |
| Weekly | 12% | 3% | 7% |
- Written by Michael Boutros, Technical Strategist with DailyFX
Follow Michael on Twitter @MBForex


