Mining
Rare Earth Elements: Where in the World Are They?
![]() Subscribe to the Elements free mailing list for more like this
Subscribe to the Elements free mailing list for more like this


Rare Earths Elements: Where in the World Are They?
This was originally posted on Elements. Sign up to the free mailing list to get beautiful visualizations on natural resource megatrends in your email every week.
Rare earth elements are a group of metals that are critical ingredients for a greener economy, and the location of the reserves for mining are increasingly important and valuable.
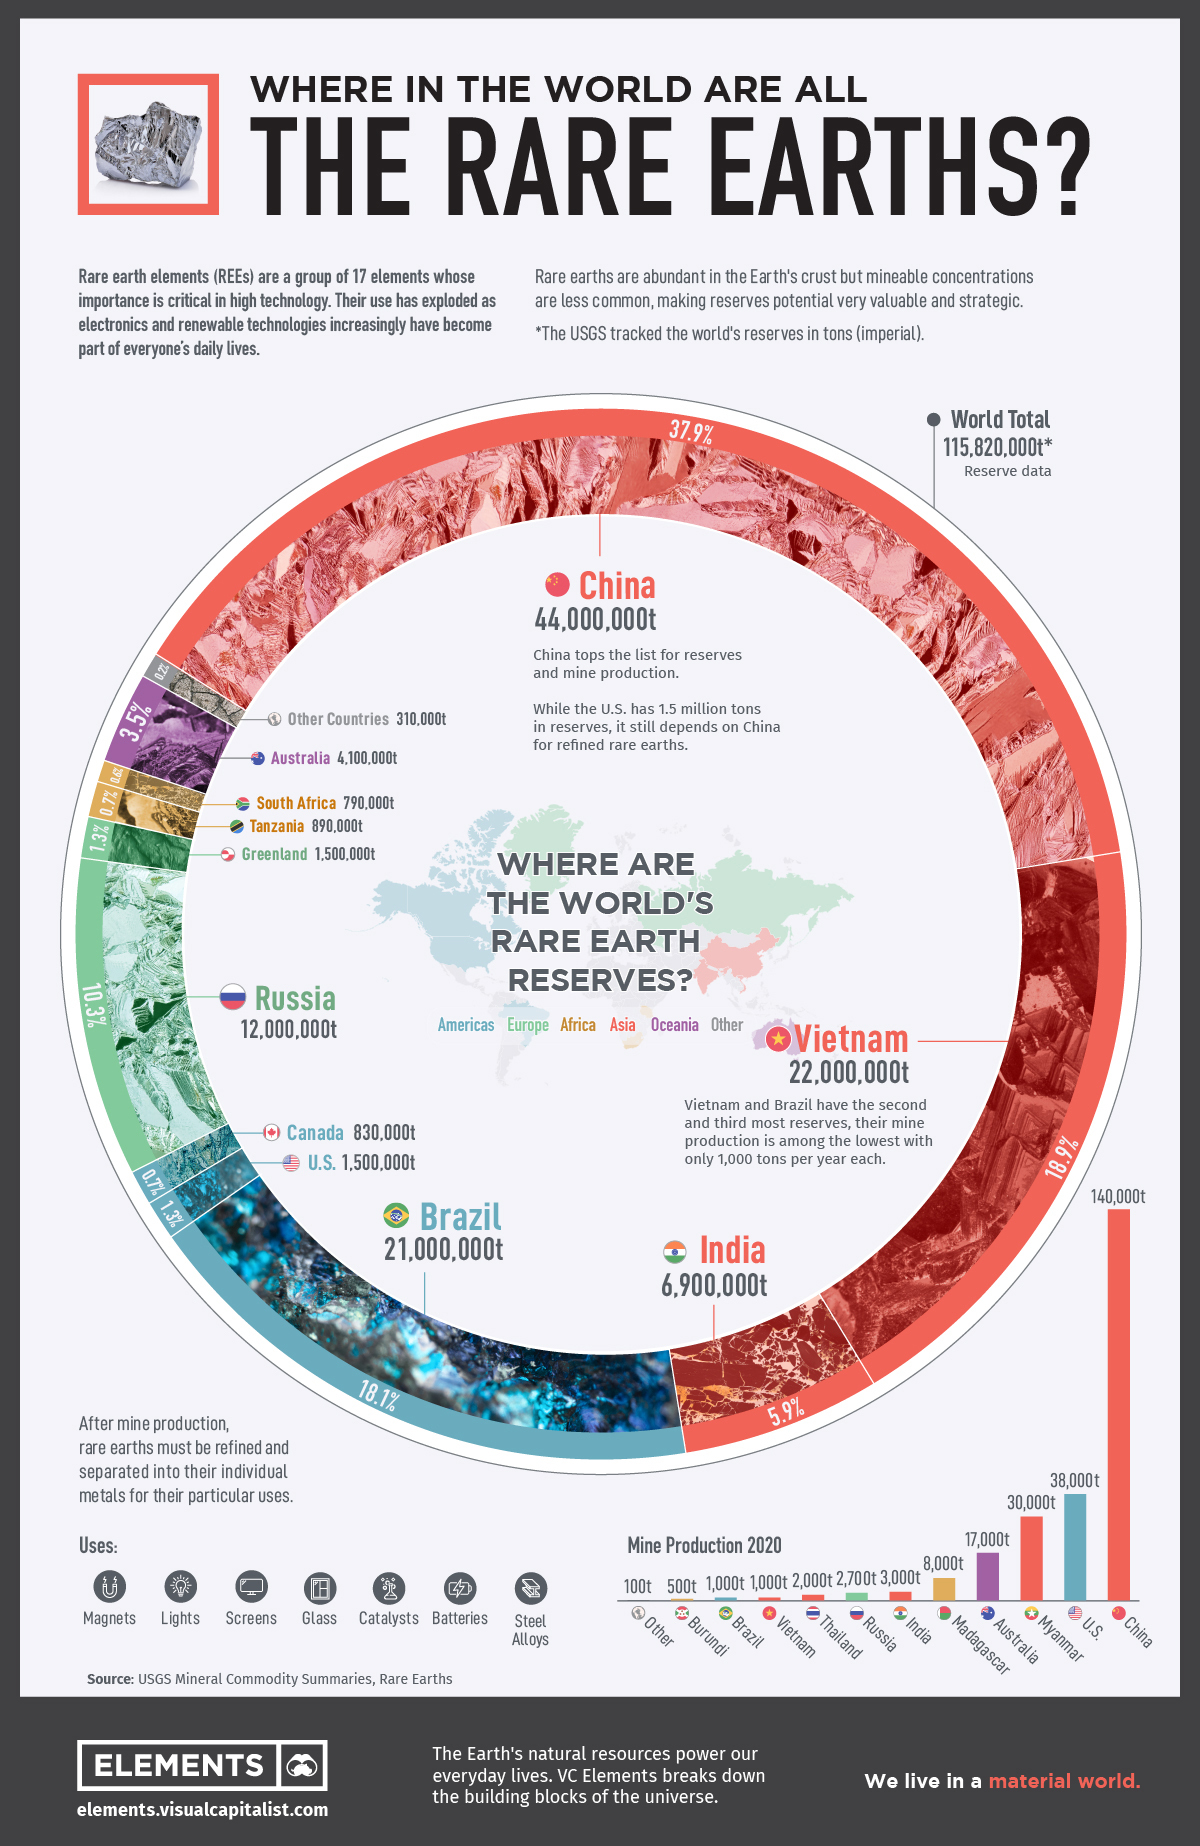
This infographic features data from the United States Geological Society (USGS) which reveals the countries with the largest known reserves of rare earth elements (REEs).
What are Rare Earth Metals?
REEs, also called rare earth metals or rare earth oxides, or lanthanides, are a set of 17 silvery-white soft heavy metals.
The 17 rare earth elements are: lanthanum (La), cerium (Ce), praseodymium (Pr), neodymium (Nd), promethium (Pm), samarium (Sm), europium (Eu), gadolinium (Gd), terbium (Tb), dysprosium (Dy), holmium (Ho), erbium (Er), thulium (Tm), ytterbium (Yb), lutetium (Lu), scandium (Sc), and yttrium (Y).
Scandium and yttrium are not part of the lanthanide family, but end users include them because they occur in the same mineral deposits as the lanthanides and have similar chemical properties.
The term “rare earth” is a misnomer as rare earth metals are actually abundant in the Earth’s crust. However, they are rarely found in large, concentrated deposits on their own, but rather among other elements instead.
Rare Earth Elements, How Do They Work?
Most rare earth elements find their uses as catalysts and magnets in traditional and low-carbon technologies. Other important uses of rare earth elements are in the production of special metal alloys, glass, and high-performance electronics.
Alloys of neodymium (Nd) and samarium (Sm) can be used to create strong magnets that withstand high temperatures, making them ideal for a wide variety of mission critical electronics and defense applications.
| End-use | % of 2019 Rare Earth Demand |
|---|---|
| Permanent Magnets | 38% |
| Catalysts | 23% |
| Glass Polishing Powder and Additives | 13% |
| Metallurgy and Alloys | 8% |
| Battery Alloys | 9% |
| Ceramics, Pigments and Glazes | 5% |
| Phosphors | 3% |
| Other | 4% |
The strongest known magnet is an alloy of neodymium with iron and boron. Adding other REEs such as dysprosium and praseodymium can change the performance and properties of magnets.
Hybrid and electric vehicle engines, generators in wind turbines, hard disks, portable electronics and cell phones require these magnets and elements. This role in technology makes their mining and refinement a point of concern for many nations.
For example, one megawatt of wind energy capacity requires 171 kg of rare earths, a single U.S. F-35 fighter jet requires about 427 kg of rare earths, and a Virginia-class nuclear submarine uses nearly 4.2 tonnes.
Global Reserves of Rare Earth Minerals
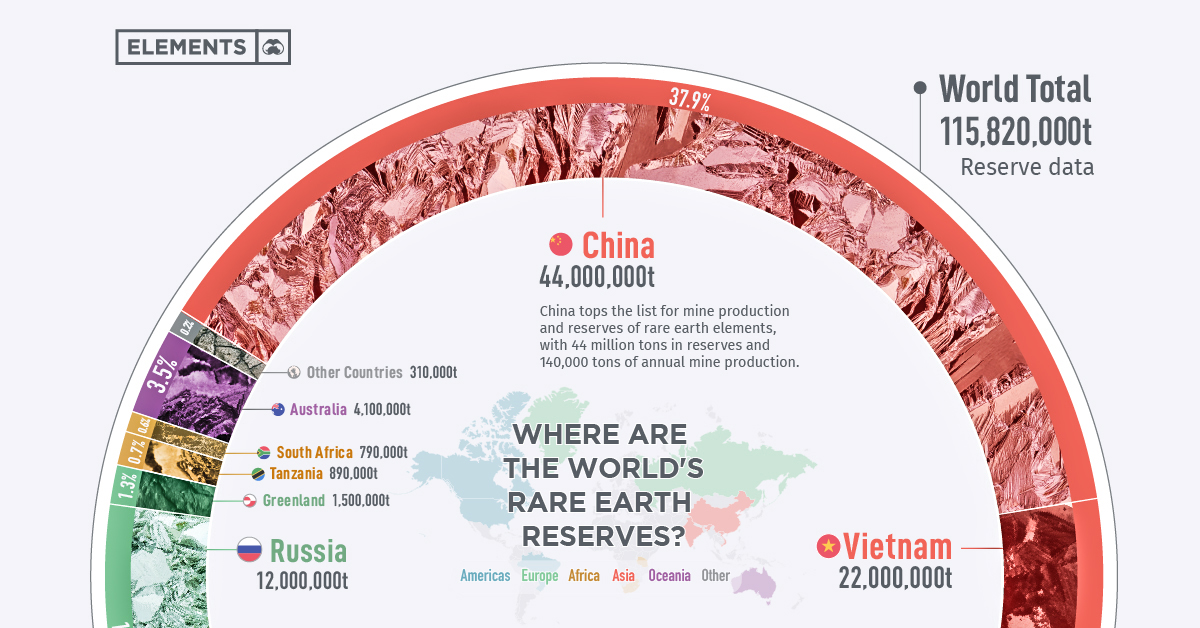
China tops the list for mine production and reserves of rare earth elements, with 44 million tons in reserves and 140,000 tons of annual mine production.
While Vietnam and Brazil have the second and third most reserves of rare earth metals with 22 million tons in reserves and 21 million tons, respectively, their mine production is among the lowest of all the countries at only 1,000 tons per year each.
| Country | Mine Production 2020 | Reserves | % of Total Reserves |
|---|---|---|---|
| China | 140,000 | 44,000,000 | 38.0% |
| Vietnam | 1,000 | 22,000,000 | 19.0% |
| Brazil | 1,000 | 21,000,000 | 18.1% |
| Russia | 2,700 | 12,000,000 | 10.4% |
| India | 3,000 | 6,900,000 | 6.0% |
| Australia | 17,000 | 4,100,000 | 3.5% |
| United States | 38,000 | 1,500,000 | 1.3% |
| Greenland | - | 1,500,000 | 1.3% |
| Tanzania | - | 890,000 | 0.8% |
| Canada | - | 830,000 | 0.7% |
| South Africa | - | 790,000 | 0.7% |
| Other Countries | 100 | 310,000 | 0.3% |
| Burma | 30,000 | N/A | N/A |
| Madagascar | 8,000 | N/A | N/A |
| Thailand | 2,000 | N/A | N/A |
| Burundi | 500 | N/A | N/A |
| World Total | 243,300 | 115,820,000 | 100% |
While the United States has 1.5 million tons in reserves, it is largely dependent on imports from China for refined rare earths.
Ensuring a Global Supply
In the rare earth industry, China’s dominance has been no accident. Years of research and industrial policy helped the nation develop a superior position in the market, and now the country has the ability to control production and the global availability of these valuable metals.
This tight control of the supply of these important metals has the world searching for their own supplies. With the start of mining operations in other countries, China’s share of global production has fallen from 92% in 2010 to 58%< in 2020. However, China has a strong foothold in the supply chain and produced 85% of the world’s refined rare earths in 2020.
China awards production quotas to only six state-run companies:
- China Minmetals Rare Earth Co
- Chinalco Rare Earth & Metals Co
- Guangdong Rising Nonferrous
- China Northern Rare Earth Group
- China Southern Rare Earth Group
- Xiamen Tungsten
As the demand for REEs increases, the world will need tap these reserves. This graphic could provide clues as to the next source of rare earth elements.


Mining
Gold vs. S&P 500: Which Has Grown More Over Five Years?
The price of gold has set record highs in 2024, but how has this precious metal performed relative to the S&P 500?

Gold vs. S&P 500: Which Has Grown More Over Five Years?
This was originally posted on our Voronoi app. Download the app for free on Apple or Android and discover incredible data-driven charts from a variety of trusted sources.
Gold is considered a unique asset due to its enduring value, historical significance, and application in various technologies like computers, spacecraft, and communications equipment.
Commonly regarded as a “safe haven asset”, gold is something investors typically buy to protect themselves during periods of global uncertainty and economic decline.
It is for this reason that gold has performed rather strongly in recent years, and especially in 2024. Persistent inflation combined with multiple wars has driven up demand for gold, helping it set a new all-time high of over $2,400 per ounce.
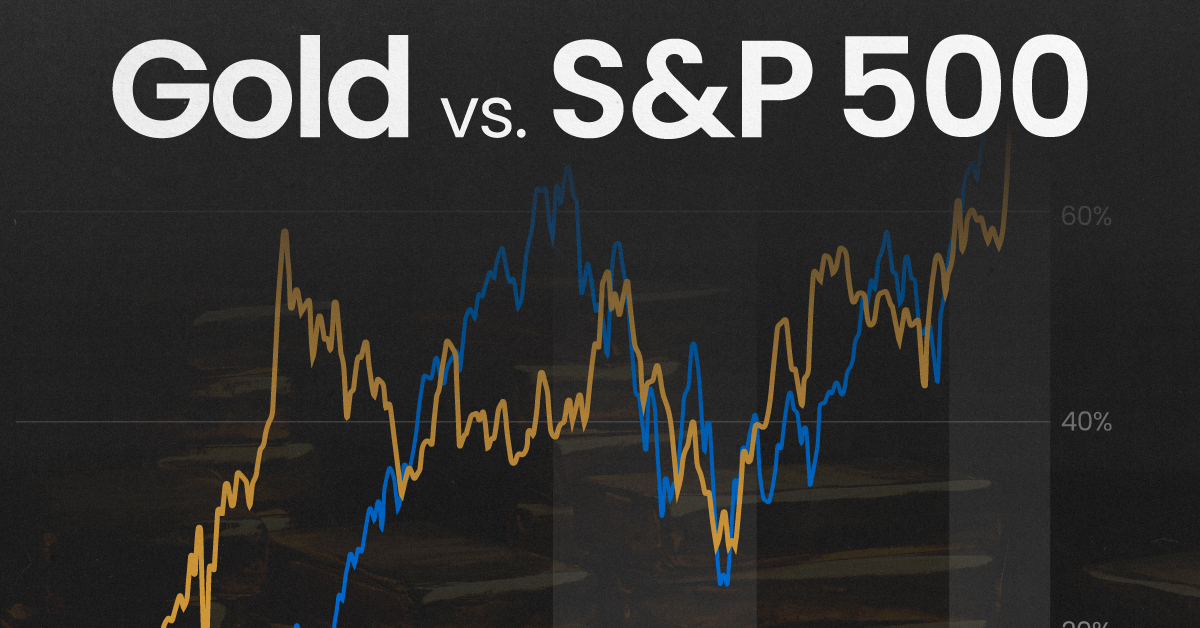
To put this into perspective, we visualized the performance of gold alongside the S&P 500. See the table below for performance figures as of April 12, 2024.
| Asset/Index | 1 Yr (%) | 5 Yr (%) |
|---|---|---|
| 🏆 Gold | +16.35 | +81.65 |
| 💼 S&P 500 | +25.21 | +76.22 |
Over the five-year period, gold has climbed an impressive 81.65%, outpacing even the S&P 500.
Get Your Gold at Costco
Perhaps a sign of how high the demand for gold is becoming, wholesale giant Costco is reportedly selling up to $200 million worth of gold bars every month in the United States. The year prior, sales only amounted to $100 million per quarter.
Consumers aren’t the only ones buying gold, either. Central banks around the world have been accumulating gold in very large quantities, likely as a hedge against inflation.
According to the World Gold Council, these institutions bought 1,136 metric tons in 2022, marking the highest level since 1950. Figures for 2023 came in at 1,037 metric tons.
See More Graphics on Gold
If you’re fascinated by gold, be sure to check out more Visual Capitalist content including 200 Years of Global Gold Production, by Country or Ranked: The Largest Gold Reserves by Country.

-

 Mining2 weeks ago
Charted: The Value Gap Between the Gold Price and Gold Miners
-

 Real Estate1 week ago
Ranked: The Most Valuable Housing Markets in America
-

 Business1 week ago
Charted: Big Four Market Share by S&P 500 Audits
-

 AI1 week ago
The Stock Performance of U.S. Chipmakers So Far in 2024
-

 Misc1 week ago
Almost Every EV Stock is Down After Q1 2024
-

 Money2 weeks ago
Where Does One U.S. Tax Dollar Go?
-

 Green2 weeks ago
Ranked: Top Countries by Total Forest Loss Since 2001
-

 Real Estate2 weeks ago
Visualizing America’s Shortage of Affordable Homes