Gold price forecast is an analysis of the factors that affect the supply and demand of the precious metal, as well as the identification of patterns, fractals, and trends emerging in the market.
Will gold rise in price? What will be the price of the precious metal in the near future? In this article, we'll look into historical data, see what experts have to say, and make a gold price forecast 2024, 2025, and a long-term one until the end of 2030.
The article covers the following subjects:
- Highlights and Key Points
- How to make a gold price forecast?
- A Recent History of Gold and Gold Price Today
- Gold Technical Analysis
- Gold weekly price forecast as of 15.04.2024
- What will happen to gold in 2024 based on technical analysis?
- XAUUSD Long-Term Trading Plan
- Gold Price Forecast 2024: What Do Experts Predict?
- Gold price expert analysis for 2025 — 2030
- How Has the Gold Price Changed Over Time?
- Factors That May Affect the Gold Price
- Conclusion: Is Gold a Good Investment?
- FAQ's
Highlights and Key Points
- The gold price will be stably growing in the long term. The historical high was set at $2431.42 on 2024-04-12.
- Most expert analysts predict that the XAUUSD rate will rise. The precious metal is expected to update its historical peak: the rate may exceed $2,300 in 2024.
- The price will continue to rise in 2024 - 2030. In optimistic scenarios, the rate will go above $4,000.
- The gold price rises during market instability and amid high demand for precious metals. The XAUUSD is considered an excellent long-term investment asset.
How to make a gold price forecast?
There are three key approaches to make a reliable gold rate prediction:
1. Fundamental analysis allows you to track changes in monetary policy and other factors affecting the price of precious metals. First of all, these are changes in the global financial system and the actions of the US central bank. Therefore, it is extremely important to take into account various macroeconomic indicators:
- federal funds rate changes;
- inflationary market expectations;
- currencies’ movements and the money supply size;
- balance of imports and exports.
It is also important to take into account the state of the main gold-importing countries since more than half of the world's demand for XAUUSD comes from India and China. It is well known that the global economy is closely related to geopolitics. This is another risk factor affecting the precious metals markets, including physical gold. For example, the aggravation of China-US relations can lead to sharp jumps in the gold price. Possible changes in the sanctions policy against Russia or China, trade wars, and political instability can greatly affect the XAU rate as well. Also, don't forget about the main producing countries, as China, Australia, Russia, and Canada account for a third of the total $US/OZ supply.
Remember that fundamental analysis is commonly used in predicting global trends.
2. Technical analysis. This approach includes studying the history of XAUUSD quotes on charts using indicators and other tools for analyzing price movements. Technical analysis can help determine support and resistance levels, trend lines, possible price breakouts and reversals both in the long term, and in intraday trading.
Gold has a directional movement in the long term. Therefore, for technical analysis, trend indicators such as Moving Averages, RSI, MACD, and Bollinger Bands are primarily used.
3. Market sentiment analysis. This approach consists in assessing the mood of buyers and sellers, namely, who has a dominant position in the market at the moment. Market sentiment analysis instruments include surveys, content monitoring in social networks, and specialized online platforms, such as litefinance.org.
It is important to remember that market sentiment can change very quickly. It is influenced by future gold price forecasts from professional analysts or, for example, by what information Fed Chairman Jerome Powell will provide.
A Recent History of Gold and Gold Price Today
From the end of 2022 to now, the gold price has grown by more than 33%, reaching a new all-time peak at $2,165.50 in March 2024. Many analysts, traders, and investors expect the asset's rally to continue in fiscal 2024. Forex market participants' significant interest in the precious metal over the past 1.5 years is mainly associated with the following fundamental factors:
Strengthening de-dollarization policy in developing countries
The precedent of freezing Russia's gold and foreign exchange reserves after the outbreak of the special military operation in Ukraine increasingly encourages developing countries to abandon the US currency in favor of other financial assets, including gold. Investment demand for the safe haven asset has grown significantly as central banks have built up their gold reserves and high global inflation has raised concerns. Moreover, that's also due to the rapid growth of the US government debt.
Thus, as of the end of 2023, the following countries increased their gold holdings: China, India, Turkey, Poland, Qatar, Belarus, Serbia, Czech Republic, Kyrgyzstan, Bangladesh, and Malta.
Rise in geopolitical concerns across the globe
The hostilities between Ukraine and Russia in Eastern Europe and the conflict between Israel and Palestine in the Middle East directly influence the current rise in gold quotes.
The associated geopolitical risks have prompted central banks in the Global South, Asia, the Middle East, and Eastern Europe to increase their gold reserves. A WGC report showed that the central banks of these countries bought around 800 tons of gold from January to September 2023, 14% more than in 2022.
Some analysts believe that central banks' demand will be one of the main triggers for the growth of the XAUUSD price in 2024. According to the WGC report, any escalation will have a positive impact on the asset's quotes.
Developed countries' recession risks
A recession threat is manifesting itself in the European and US economy. Thus, bankrupt enterprises in the United States and the eurozone increased 18% and 30% last year, respectively.
In Germany, one of the leading economies of the European Union, 25% more companies went bankrupt in 2023 than in the reporting year 2022. In England, Sweden, Denmark, and Finland, the number of bankrupt companies in 2023 exceeded the maximum of the 2008-2009 financial crisis.
Such indicators are based on higher interest rates and borrowing costs, on the one hand, and the cancellation of government pandemic support, on the other. Energy prices continue rising and also have a direct impact.
Despite the risks of a US government shutdown, the country's government had difficulty reaching a compromise on the federal budget of 1.6 trillion dollars for 2024.
The combination of those factors made many companies go bankrupt. According to the rating agency Moody’s, the number of bankrupt companies will continue to grow in 2024.
Odds of rate cuts by central banks
The current US interest rate is 5.5%, and inflation slowed to 3.1% in January 2024. According to Federal Reserve Chairman Jerome Powell's recent statements, interest rates may be cut and monetary policy eased as early as this year, most likely at the Fed meeting in June.
Nevertheless, the Fed chair made it clear that the Central Bank must ensure that inflation is steadily declining towards 2% to cut rates.
Besides Jerome Powell, ECB spokeswoman Christine Lagarde also announced an intention to ease policy at the June meeting. So far, the European Central Bank left the rate unchanged at 4.5% at its recent meeting in March.
Lower rates could restore investors' risk appetite and resume money flowing from protective assets like gold.
The current gold price forecast for today 20.04.2024 is $2 391.72.
Gold Technical Analysis
To develop a more detailed trading plan for the XAUUSD over the next year, we must perform technical analysis on several time frames, varying from H4 to MN. Thus, we'll have a general strategic idea about this asset.
We'll use the following technical instruments: MACD, RSI, OBV, VWAP, and SMA to identify key support/resistance, oversold/overbought areas, and the current trend strength. We'll also use candlesticks and pattern analysis to confirm indicators' trading signals and determine the best entry points.
The popular Price Action patterns in gold charts are Bull flags, Engulfing patterns, Double Bottoms, Double Tops, and others.
We'll first analyze the monthly time frame to evaluate the current gold market state.
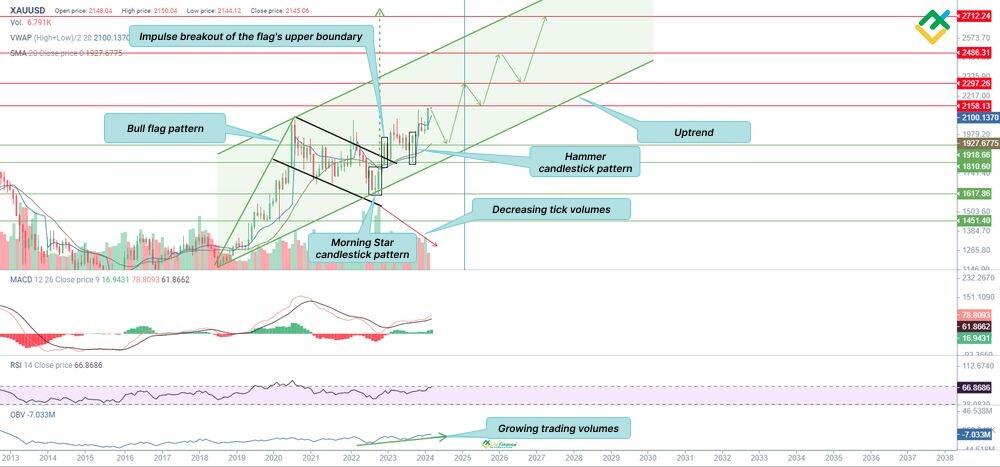
Gold's monthly chart shows a large bull flag pattern forming. A momentum breakout of its upper boundary took place at 1848.34.
Before the flag was broken, the asset's price formed the Morning Star candlestick pattern at 1617.86 in October 2022, warning market participants of an upcoming upward movement. Moreover, another candlestick analysis pattern — Hammer — formed at 1918.66 in September 2023, creating a precondition for intensive price growth to a new all-time high of 2150.04.
OBV trading volumes have grown since August 2022, signaling active gold buying amid rising global geopolitical and economic risks. RSI readings are moving to the upper boundary. They are currently at 66, pointing to further growth potential. The MACD has been increasing sharply in the positive zone since February 2024, indicating a potential ascending movement. The VWAP line and the SMA20 are below the price in the gold chart, indicating bullish activity.
Tick volumes decrease after the flag breakout, indicating a low trading frequency and investors' fading interest in the trading asset. Most likely, that's due to the renewal of the historical high, and market participants are simply waiting for further developments to make trading decisions.
Gold weekly price forecast as of 15.04.2024
Last week, the gold market reached Target Zone 5, 2435 - 2426. Large purchases were exited in TZ 5, and the gold price started a correction, reaching support (А) 2337 - 2328. The zone has not been broken out, and one can enter long trades in the zone this week; the upside target is April’s high.
If the price breaks out support (A), the correction will continue down to support (В) 2290 - 2276. It is also relevant to buy in the support (B) zone with a target at April’s high.
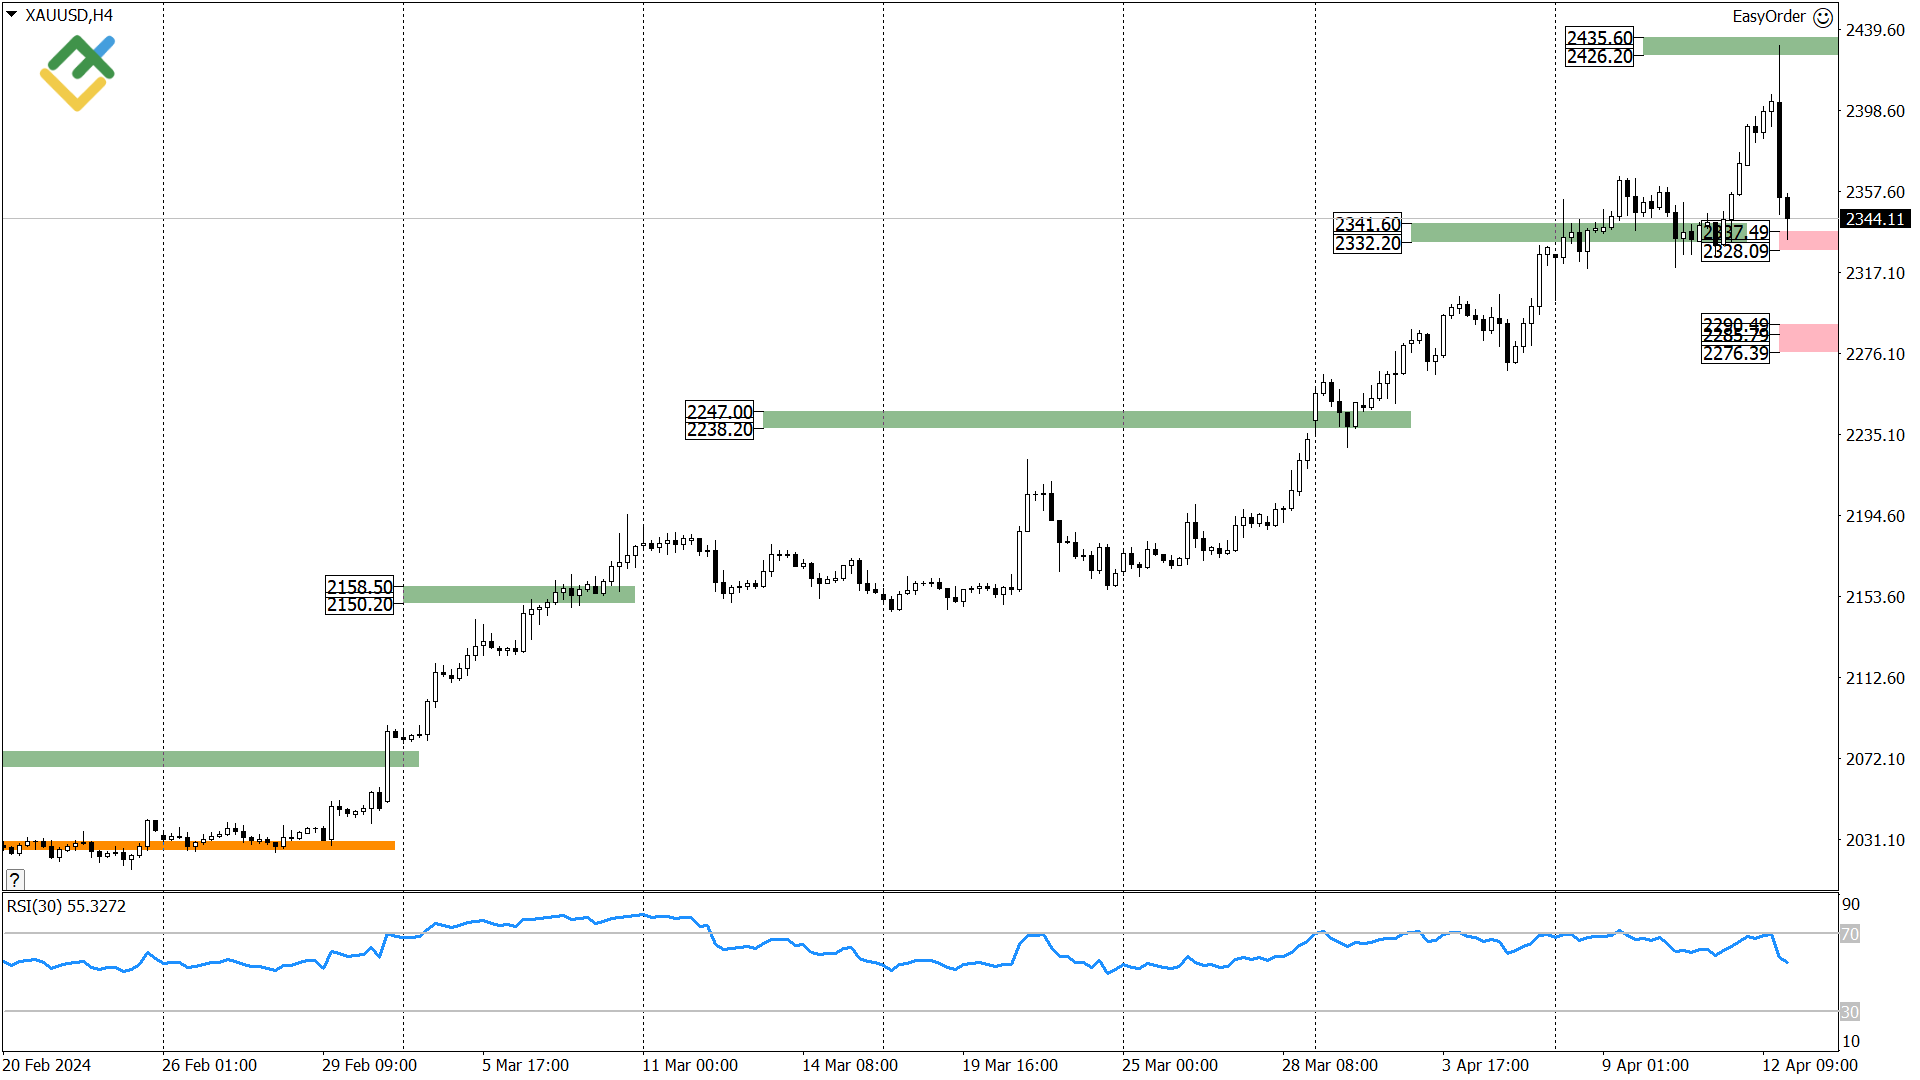
XAUUSD trading ideas for the week:
- Buy according to the pattern in support (А) 2337 - 2328. TakeProfit: 2428. StopLoss: according to the pattern rules.
- Buy according to the pattern in support (В) 2290 - 2276. TakeProfit: 2428. StopLoss: according to the pattern rules.
Technical analysis based on margin zones methodology was provided by an independent analyst, Alex Rodionov.
XAUUSD Forecast For Next Three Months
We'll perform technical analysis for the next three months using H4 and D1 time frames.
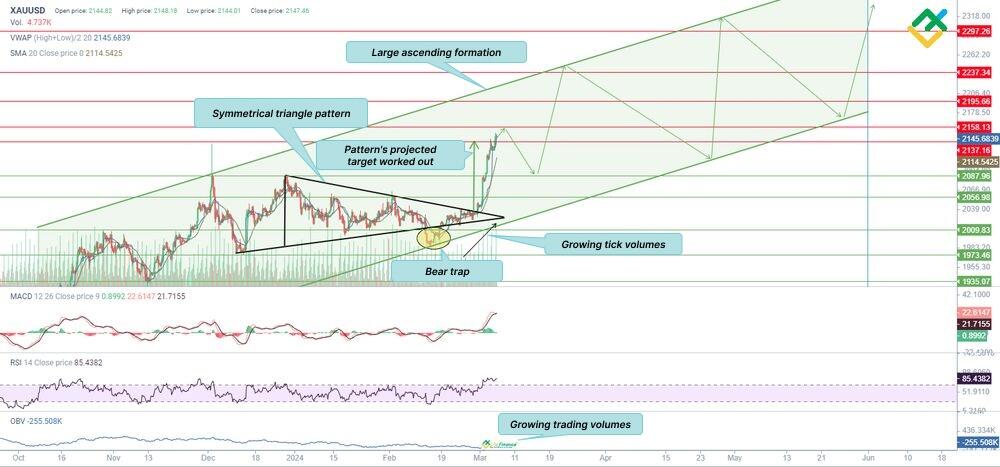
The symmetrical triangle pattern is developing on the H4 time frame, whose target has already been reached when the price perpendicularly grew to 2137.16. I'd like to mention that before momentum price growth happened, a Bear Trap formed in the chart, becoming one of the growth drivers. The asset's price is currently hovering at around 2144.80.
Besides, the chart shows a surge in tick volumes and OBV volume growth, indicating market participants' interest in gold purchasing.
The MACD indicator is declining in the positive zone to the zero boundary. The RSI is in the overbought zone, signaling an upcoming price reversal to the downside.
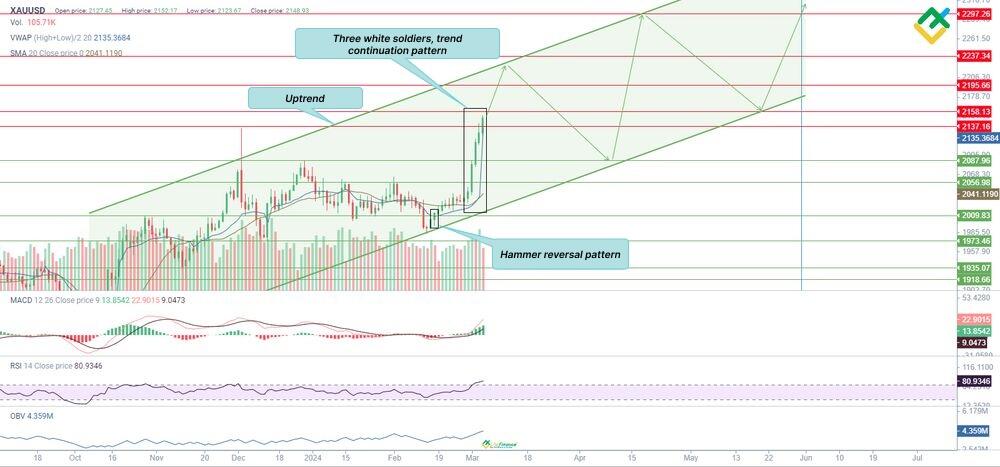
The daily chart shows drastic growth to a new all-time high through the Three White Soldiers candlestick formation. At the same time, the Hammer reversal pattern is developing near support at 2009.83.
The MACD values steadily grow in the positive zone, an upbeat signal for the bulls. OBV market volumes are also rising. The price is located above the VWAP weighted average price.
The RSI is above 80 in the overbought zone, which may signal an upcoming price reversal to the downside.
The price should most likely correct downwards to 2087.96 in the next three months, with a subsequent upward reversal within an ascending pattern.
What will happen to gold in 2024 based on technical analysis?
A likely scenario for 2024 is that gold quotes evolve in a stable uptrend, gradually updating price highs. A weekly time frame is the most convenient to make a more detailed price forecast for XAUUSD rate trends this year.
Long-term trading plan for GOLD
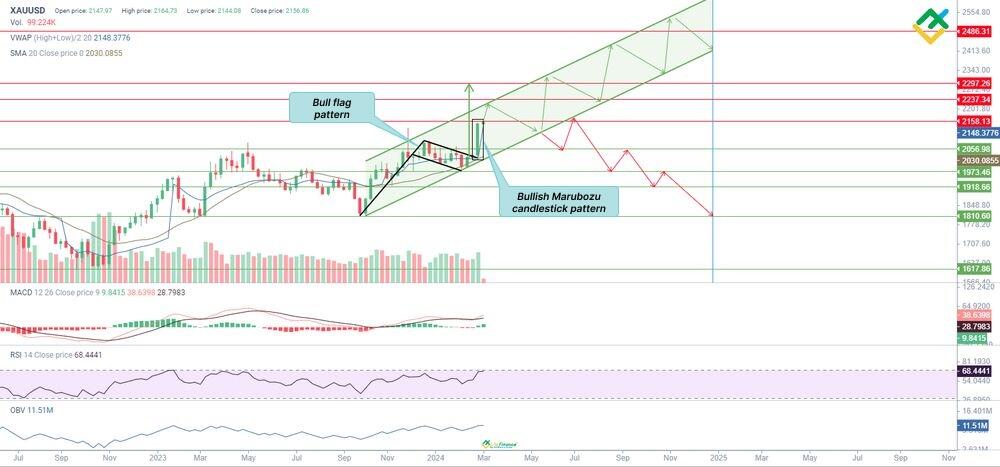
The bullish flag chart pattern can be seen forming on the weekly time frame, indicating the asset's stable positive trend. The expected pattern target is located in the area of 2297.26.
The impulse bullish candle Marubozu confirms the flag, also signaling uptrend continuation.
The MACD values did not trade long in the negative zone, turned upwards and are actively growing in the positive zone amid increased volumes, according to the OBV indicator.
Upon the bull flag breakout, tick volumes rose sharply, indicating market participants' interest.
The RSI trades near the upper boundary, showing slight growth potential with a possible move to the overbought zone. The VWAP and the SMA20 lines are below the price, confirming buying activity.
Based on the analysis above, I have made a rough forecast for maximum and minimum price values for each month of 2024.
| Month | XAUUSD projected values | |
|---|---|---|
| Minimum | Maximum | |
| April 2024 | 2,152.17 | 2,225.11 |
| May 2024 | 2,163.94 | 2,227.46 |
| June 2024 | 2,145.11 | 2,175.70 |
| July 2024 | 2,147.47 | 2,236.87 |
| August 2024 | 2,225.11 | 2,295.69 |
| September 2024 | 2,283.87 | 2,373.34 |
| October 2024 | 2,335.69 | 2,382.75 |
| November 2024 | 2,323.93 | 2,540.39 |
| December 2024 | 2,439.21 | 2,552.15 |
XAUUSD Long-Term Trading Plan
The gold rate is expected to evolve in an uptrend in 2024. Based on the technical analysis, the asset has every foundation for continued positive development.
Moreover, our analysis identified the most liquid buy and sell zones that can be used in a trading strategy.
Trading plan for the next three months
Based on the technical analysis, our 3-month plan can be the following:
- the asset's key support levels: 2,087.96, 2,056.98, 2,009.83, 1,973.46, 1,935.07, 1,918.66;
- the key resistance: 2,137.16, 2,158.13, 2,195.66, 2,237.34, 2,297.26;
- technical indicators on H4 and D1 time frames signal an upcoming downward correction to 2,087.96 after updating the all-time price high. However, general sentiment remains positive, with a target of around 2,297.26.
Trading plan for 2024:
- the key support: 2,056.98, 1,973.46, 1,918.66, 1,810.60, 1,617.86;
- the key resistance: 2,158.13, 2,237.34, 2,297.26, 2,486.31;
- the uptrend is expected to develop further, with the price possibly reaching 2486.31 by the end of this year;
- An alternative scenario may play out if sellers break out the downward trend line and consolidate below 2,056.98. In that case, negative momentum may strengthen, and the price may be headed for the levels at 1,973.46-1,810.60.
Start trading with a trustworthy broker
Gold Price Forecast 2024: What Do Experts Predict?
In 2024, like the stock market, gold breaks historical records, currently trading above $2160.00 a troy ounce. The precious metal is in demand as a protective instrument on the back of global geopolitical tensions.
Gold is also supported by active buying by institutional investors and central banks, notably the Central Bank of China. This trend will likely continue in 2024. At the same time, Chinese buyers increased their gold consumption amid domestic economic problems.
The main factors that will influence gold this year are the following:
- The escalation of tensions in Eastern Europe and the Middle East may give an extra stimulus to the precious metal's quotes. Further hostilities between the Yemeni Houthis and the US-led coalition in the Red Sea could provoke another round of tension in the Middle East;
- Monetary policy of the US, EU, and other regulators. Investors' main attention is focused on the Fed's steps to reduce inflation.
- Rate cuts are expected to begin in Q3 2024, which will increase large market players' risk appetite and money flowing into risk-on assets;
- Growing demand for protective assets is also connected with uncertainty amid the upcoming US elections;
- The US-China trade war, along with anti-Russian sanctions, has already disrupted supply chains and increased prices of many goods, including gas, oil, and essential goods. Further escalation could continue this trend and positively impact the price of yellow metal.
Based on the factors above, the price of gold will likely continue to rise and update historical highs in 2024.
Many international analytical agencies expect gold to continue to grow popular with investors.
UBS
UBS Group AG's experts predict that gold price will grow 10% to $2,250 an ounce by the end of 2024. The main reasons for growth are the following:
- Growing geopolitical tensions amid new global conflicts;
- Ongoing macroeconomic risks associated with inflation and regulators' policies.
UBS expects the gold price to be above the psychological level of $2,000 per ounce, emphasizing the advisability of gold investing to hedge and diversify risks.
Bank of America
The bank's experts directly link growing gold quotes to the rise in oil prices amid a threat of escalation in the Middle East, which could lead to various human-made disasters and destruction of the energy infrastructure in the Middle East region.
The analysts claim that such actions could increase oil prices to $150 per barrel as early as 2024, which, in turn, may lead to higher gold prices, up to $2,400 per ounce.
JP Morgan
One of the largest banks in America, JP Morgan, estimates that the average gold price may hover around $2,175 by the end of 2024, which may be linked to the projected start of the Fed's policy easing cycle in Q3 this year and to falling US real yields.
Wallet Investor
According to Wallet Investor's information, the XAUUSD quotes will hover at 2133.79-2167.39 this year. The average price is expected to be at 2,150.00 USD by year-end.
The price is forecast to climb to 2154.47-2201.41 in the first three months of 2025.
Long Forecast
Analysts at the Economy Forecast Agency believe that gold prices may reach above $2,300 an ounce as early as March 2024. Price growth to $2,500 in May and April may be followed by a correction to $ 2,483 in June. Next, the experts expect gold quotes to rise to $2,652 an ounce by the end of 2024.
| Month | Opening | Low-High | Closure |
|---|---|---|---|
| 2024 | |||
| April | 2,360 | 2,212-2,631 | 2,506 |
| May | 2,506 | 2,375-2,625 | 2,500 |
| Jun | 2,500 | 2,359-2,607 | 2,483 |
| July | 2,483 | 2,399-2,651 | 2,525 |
| August | 2,525 | 2,453-2,711 | 2,582 |
| September | 2,582 | 2,582-2,879 | 2,742 |
| October | 2,742 | 2,470-2,742 | 2,600 |
| November | 2,600 | 2,424-2,680 | 2,552 |
| December | 2,552 | 2,519-2,785 | 2,652 |
| 2025 | |||
| January | 2,652 | 2,452-2,710 | 2,581 |
| February | 2,581 | 2,429-2,685 | 2,557 |
| March | 2,557 | 2,444-2,702 | 2,573 |
| April | 2,573 | 2,573-2,870 | 2,733 |
| May | 2,733 | 2,469-2,733 | 2,599 |
| June | 2,599 | 2,599-2,876 | 2,739 |
Coin Price Forecast
Based on Coin Price Forecast data, the gold price may grow to $2,200 an ounce by mid-2024. Besides, the positive trend will also continue in 2025. The gold price is expected to reach 2,700 USD by the end of 2025.
Gold price expert analysis for 2025 — 2030
Many analytical agencies forecast that gold's positive trend will strengthen at different growth paces in the next six years.
Long Forecast
According to the Economy Forecast Agency, the gold price will be $2,652 an ounce by year-end. Then, the asset's value will drop to 2,557 USD in March 2025. Next, an uptrend will continue, with gold quotes expected to rise to $2,704 a troy ounce by the end of 2025.
In January 2026, the XAUUSD's closing price will be around $2,632. Next, the price is expected to correct to a minimum of $2,517.00 within three months and to rally further to $2,761 by the end of the year. In 2027, the price is forecast to fluctuate between $2,432.00 and $2,848.00.
Gold prices are expected to rise dramatically in the first four months of 2028, reaching a level of 2921.00 in April.
| Month | Opening | Low-High | Closure |
|---|---|---|---|
| 2025 | |||
| January | 2,652 | 2,452-2,710 | 2,581 |
| February | 2,581 | 2,429-2,685 | 2,557 |
| March | 2,557 | 2,444-2,702 | 2,573 |
| April | 2,573 | 2,573-2,870 | 2,733 |
| May | 2,733 | 2,469-2,733 | 2,599 |
| June | 2,599 | 2,599-2,876 | 2,739 |
| July | 2,739 | 2,671-2,953 | 2,812 |
| August | 2,812 | 2,812-3,135 | 2,986 |
| September | 2,986 | 2,783-3,075 | 2,929 |
| October | 2,929 | 2,695-2,979 | 2,837 |
| November | 2,837 | 2,605-2,879 | 2,742 |
| December | 2,742 | 2,569-2,839 | 2,704 |
| 2026 | |||
| January | 2,704 | 2,500-2,764 | 2,632 |
| February | 2,632 | 2,448-2,706 | 2,577 |
| March | 2,577 | 2,391-2,643 | 2,517 |
| April | 2,517 | 22,431-2,687 | 2,559 |
| May | 2,559 | 2,559-2,854 | 2,718 |
| June | 2,718 | 2,537-2,804 | 2,670 |
| July | 2,670 | 2,618-2,894 | 2,756 |
| August | 2,756 | 2,601-2,875 | 2,738 |
| September | 2,738 | 2,642-2,920 | 2,781 |
| October | 2,781 | 2,556-2,826 | 2,691 |
| November | 2,691 | 2,562-2,832 | 2,697 |
| December | 2,697 | 2,623-2,899 | 2,761 |
| 2027 | |||
| January | 2,761 | 2,461-2,761 | 2,590 |
| February | 2,590 | 2,590-2,889 | 2,751 |
| March | 2,751 | 2,706-2,990 | 2,848 |
| April | 2,848 | 2,668-2,948 | 2,808 |
| May | 2,808 | 2,502-2,808 | 2,634 |
| June | 2,634 | 2,434-2,690 | 2,562 |
| July | 2,562 | 2,562-2,857 | 2,721 |
| August | 2,721 | 2,449-2,721 | 2,578 |
| September | 2,578 | 2,419-2,673 | 2,546 |
| October | 2,546 | 2,328-2,573 | 2,450 |
| November | 2,450 | 2,310-2,554 | 2,432 |
| December | 2,432 | 2,432-2,712 | 2,583 |
| 2028 | |||
| January | 2,583 | 2,532-2,798 | 2,665 |
| February | 2,665 | 2,607-2,881 | 2,744 |
| March | 2,744 | 2,744-3,060 | 2,914 |
| April | 2,914 | 2,775-3,067 | 2,921 |
Coin Price Forecast
According to Coin Price Forecast, the gold price will be $2,369 an ounce by year-end. The price is projected to rise to $2,589 in the first half of 2025 and reach $2,769 by the end of 2025, equivalent to a 27% increase compared to the current value.
From 2026 to 2030, the gold price is expected to climb to $4192.00, a 51% increase compared to the current value.
| Year | Mid-Year | Year-end |
|---|---|---|
| 2025 | $2,589 | $2,769 |
| 2026 | $2,801 | $2,809 |
| 2027 | $2,894 | $3,130 |
| 2028 | $3,345 | $3,560 |
| 2029 | $3,703 | $3,865 |
| 2030 | $4,133 | $4,192 |
*Please note that long-term price predictions for any investment asset (including gold price forecast) are very approximate and may change due to various factors. Keep reading to find out which factors may affect gold forecast.
How Has the Gold Price Changed Over Time?
The value of gold depends on various political and economic factors. However, the key point to consider when predicting gold’s price is the American dollar, as the value of the yellow metal is established in USD.
A strong dollar makes gold cheaper; conversely, a weaker US currency makes gold more expensive. Moreover, the United States of America is the largest holder of gold bullion reserves, amounting to about 8.1 thousand tons.
The gold price started climbing at the beginning of November 2022, reaching $1,854.38 by the end of December 2023. Upon reaching the level of 1,999.47 in May 2023, the asset's price reversed. Since then, gold has lost around 13% in value, dropping to $1,810.40.
The price of the XAUUSD began strong recovery again amid the Palestinian-Israeli conflict in the Middle East, which broke out in October 2023. By year-end, the gold value grew by over 12%. As of the end of December, the gold price was at 2041.19. Gold quotes consolidated in the range of 2,088.40-1,984.23 in the first two months of 2024.
Large market actors grew particularly interested in gold buying at the beginning of March 2024 on the back of a US macroeconomic data release. Fed Chairman Jerome Powell's statements have supported further momentum to date. We can single out the following key points:
- the interest rate is likely at the peak of the current cycle;
- the labor market remains relatively tight;
- demand for labor continues to exceed supply;
- the economic outlook is vague, and further progress toward achieving 2% inflation is not guaranteed. However, beginning to scale back tight policy will become appropriate at some point this year.
US indexes also hit new highs, like gold quotes. A correction will happen sooner or later, so investors hedge their positions through gold to secure their money.
It should be noted that growing tensions in Eastern Europe and the Middle East have market participants developing more conservative approaches. Another escalation between the Yemeni Houthis and the US-led coalition in the Red Sea may lead to unforeseen consequences.
For example, four undersea cables that connect Europe, Eastern Asia, Africa, and Arab countries were cut in the Red Sea over the past month, which resulted in global Internet outages. That may seriously affect some financial markets and companies. Besides, Houthi attacks on merchant ships carrying goods and raw materials disrupted supply chains. That dangerous precedent may have grave consequences, up to the development of new crises.
Another driver in the increased demand for gold is active gold buying by central banks amid fears linked to the precedent of confiscating and freezing Russian gold and foreign exchange reserves.
In 2024, the gold price will depend on further Fed narratives, geopolitics, and the upcoming US presidential election.
Factors That May Affect the Gold Price
Typically, traders associate fundamental analysis with the stock market, not gold. While fundamental analysts monitor certain companies' financial statements, gold market analysts monitor macroeconomic factors, political and economic world stability, and competition from investment alternatives to forecast prices. Let's look into five macroeconomic parameters that can influence the cost of the main precious metal.
Inflation
Inflation has an impact on the value of XAU, but not as much as one might think. Most novice gold investors believe that if it rises in the US, then gold price should also go up since more inflationary dollars will have to be paid per ounce. However, in the long term, there is no strong correlation between inflation and gold prices. This can be seen from the chart below, which shows its dynamics in the US and gold prices.
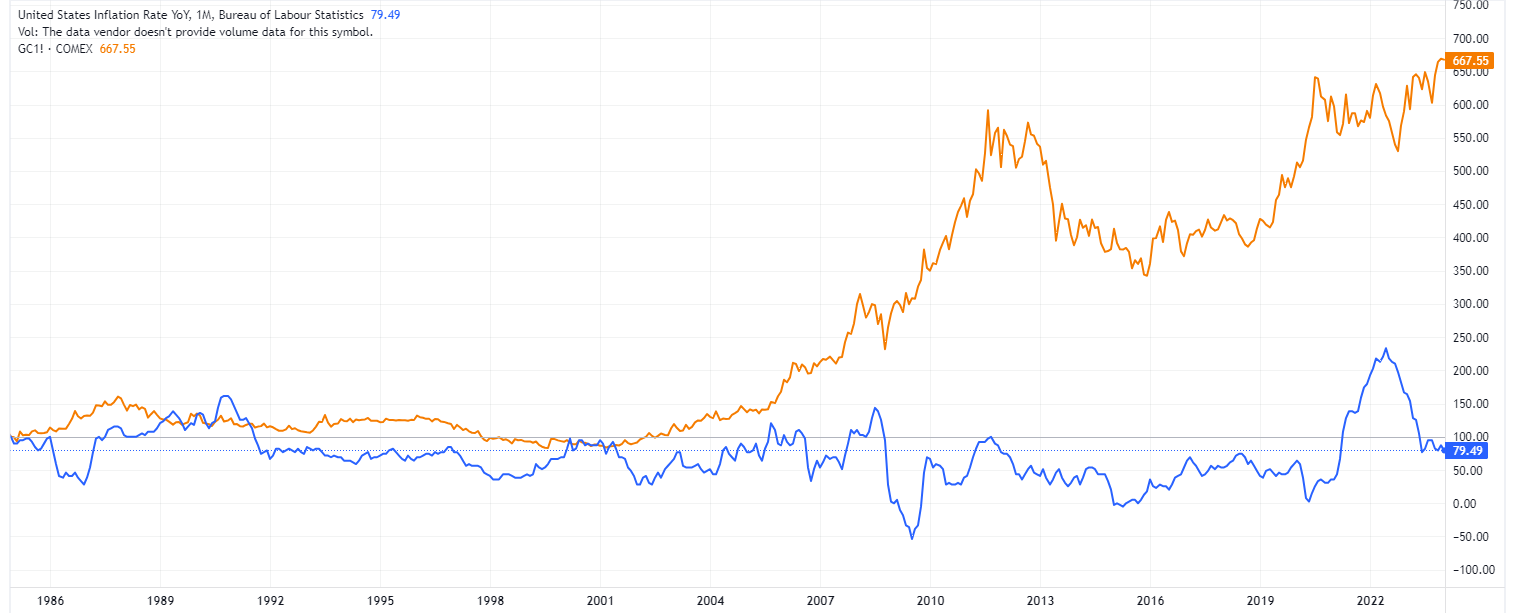
Source: Tradingview.com
This lack of a strong correlation can be explained by two major factors:
a) Gold is not a commodity. That is, it is not consumed by industry, like oil or ferrous metals, and therefore reacts to the purchasing power of the currency differently than other goods
b) During periods of economic and stock market growth, gold has to “compete” for profitability and investor attention. Moreover, during such periods, inflation is usually at a high level.
Currency Fluctuations
Gold, along with the US dollar, which is losing its reserve currency function, is a safe haven asset. Therefore, if the exchange rate of one of the currencies (for example, the dollar) depreciates relative to the other reserve currencies, while the purchasing power of buying gold in other currencies is preserved, then the logical consequence is the rise in the gold price relative to the depreciated currency. The chart shows an inverse long-term relationship between the US dollar index (white line) and the dynamics of gold prices (yellow line).
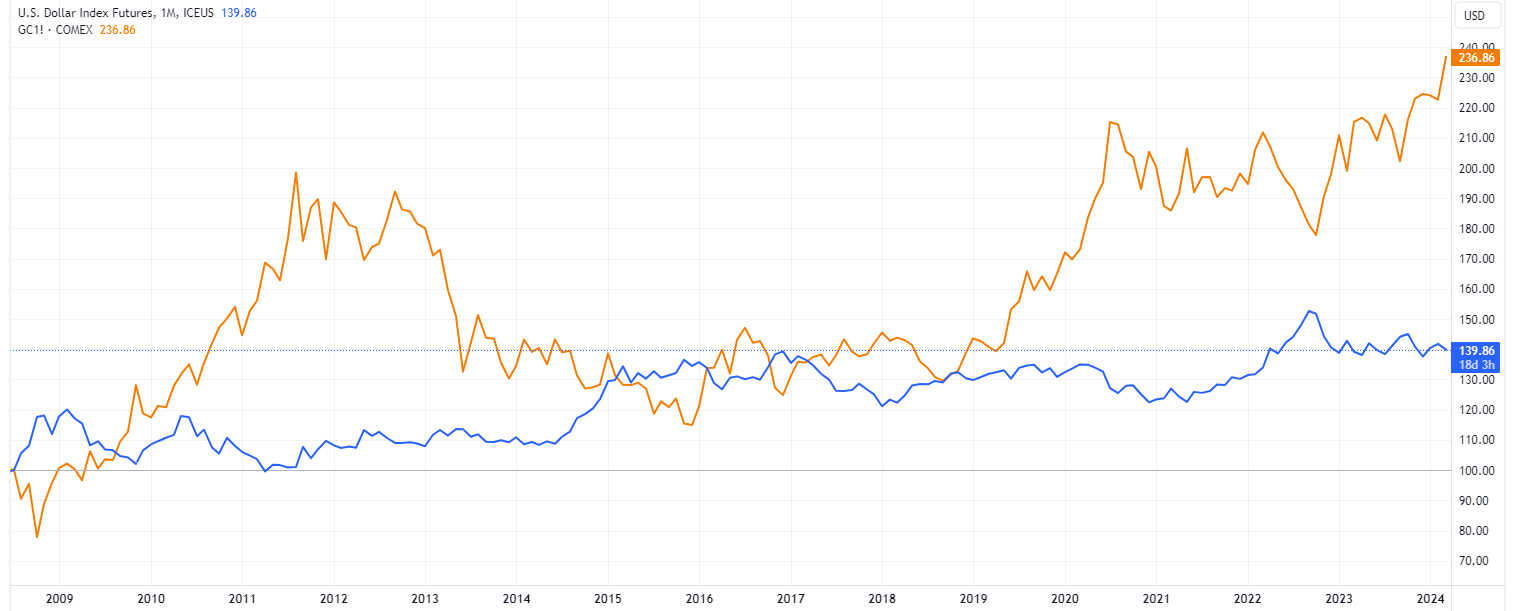
Source: Tradingview.com
The Risk of a Recession Due to Geopolitical Tensions
Any military conflict is the most significant (after financial market crises) source of economic uncertainty for investors. Gold is best used as a safe investment in times when investors are terrified, and regional conflicts may well cause such conditions in the market. They are also associated with several other factors that drive prices up, including excessive spending, money supply, political instability, and currency depreciation.
Interest Rates
Gold is sensitive to interest rates because it does not generate current income. Therefore, it is highly sensitive to alternatives in the stock market that offer potential income, such as bonds or even stocks that pay dividends. There is a noticeable, albeit not perfect, negative correlation. When US government bond yields rise, the likelihood is high that gold will trend sideways or even downtrend, while declining yields tend to lead to very positive movements in gold prices.
For example, to combat the recession in the early 2000s, the federal reserve lowered interest rates to very low levels, forcing long-term investors to withdraw from low-yield bonds and diversify their portfolios with gold. This provided good support to the already rising gold prices. On January 26, 2022, the Fed provided clues on rate hikes, which led to a sharp decline from $1,847.61 to $1,791,03 on January 26-28.
Supply and Demand
Supply and demand are the most difficult factors in assessing the impact on the cost of metal. Large investors in gold, including central banks, the IMF, and leading funds, significantly impact the market. The actions of these participants can substantially change the demand for gold jewelry and investment instruments.
Accounting for the actions of these large players is an impossible task for an ordinary private investor who does not have access to the disclosed information of all the players' economic data.
For a general understanding of the market balance, you need to know that most of the demand for gold is more or less evenly distributed between investment instruments and jewelry.
As an example, it is shown below that China and India (with strong economic growth) have become major buyers of gold over the past two decades to invest and create reserves and, therefore, have provided an additional stimulus for price increases.
China, Central Bank gold reserves, t.:
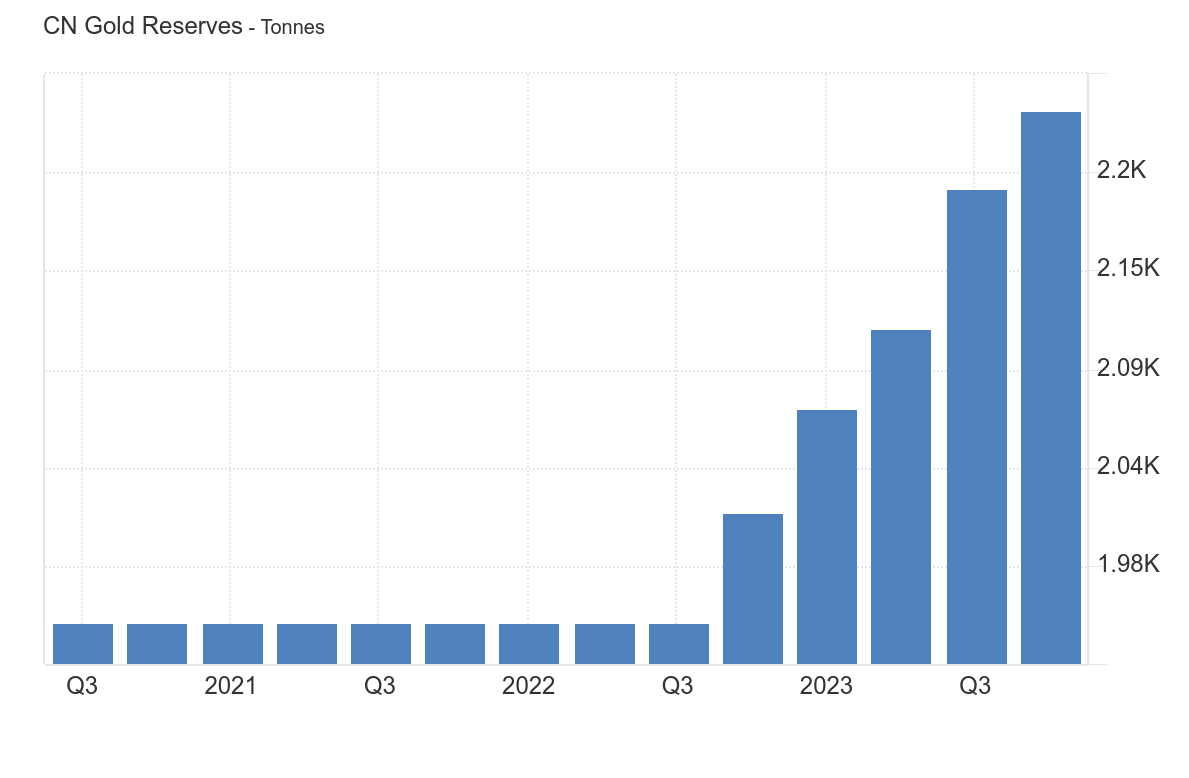
Source: TradingEconomics.com
India, Central Bank gold reserves, t.:
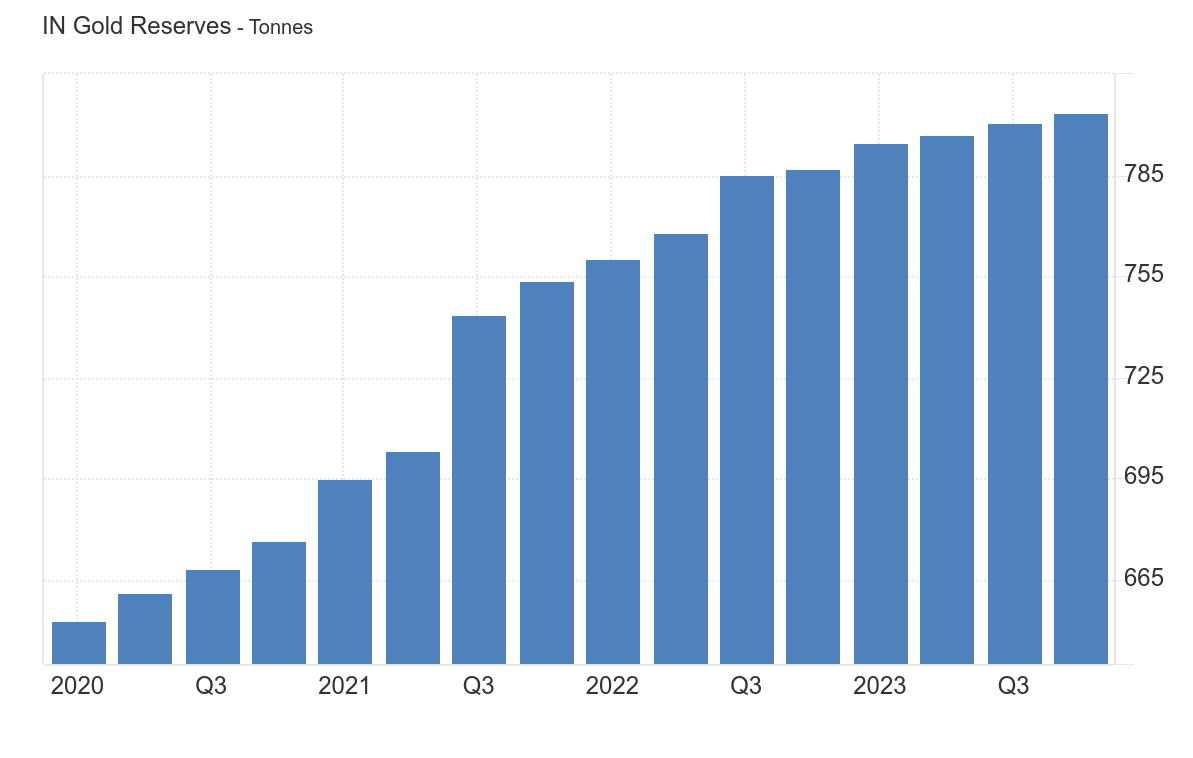
Source: TradingEconomics.com
Conclusion: Is Gold a Good Investment?
Not only is gold known for being a portfolio diversifier, but with inflationary pressures on the rise, investors tend to turn to gold because it is considered a good hedge against rising prices.
"During periods of systemic risk, both gold and the dollar tend to be used as safe haven assets and may move in a similar direction," says Juan Carlos Artigas, Head of Research, World Gold Council.
Gold long forecast for 2024-2030 is positive.
| Year | Mid-Year | Year-End |
|---|---|---|
| 2024 | 2346 $ | 2369 $ |
| 2025 | 2589 $ | 2769 $ |
| 2026 | 2801 $ | 2809 $ |
| 2027 | 2894 $ | 3130 $ |
| 2028 | 3345 $ | 3560 $ |
| 2029 | 3703 $ | 3865 $ |
| 2030 | 4133 $ | 4192 $ |
Source: Coin Price Forecast
As new initiatives of the world's central banks and governments to support markets and economies were successfully implemented in 2021, the gold price may have shown a decline. However, new waves of coronavirus, skyrocketing inflation, political tensions, and conflict destabilize the situation, so we have a reason to expect an expert gold price forecast to come true - the price will continue to rise up to $2,100 in 2024 - 2025.
Make sure to create a free demo account on LiteFinance! On LiteFinance, you will be up to date on interesting updates about Gold as an investment asset, and the user-friendly interface will come in handy if you decide to start trading Gold or any other asset.
FAQ's
The current price of gold for today 20.04.2024 is $2 391.72
In the first place, the yellow metal exchange rate is affected by the American dollar. So, the further evolution of XAUUSD quotes will depend on the Federal reserve’s narrative. Besides, the asset reacts sharply to rising geopolitical tensions, as well as to macroeconomic factors. Investors may continue to hedge their investment portfolios as global conflicts expand and the stock market remains overheated. Many experts believe the asset's value is just beginning to grow sharply. The target zone where gold will trade this and next year varies from $2,200 to $2,500 per troy ounce.
Since ancient times, gold has been considered a key protective instrument that backs up national currencies and well-being. So, buying gold is undoubtedly safe as its value grows over time.
Many experts and analysts assert that the gold price will only increase in the next 5-6 years and may reach over $4,000 per ounce by 2030. The main factor in the safe-haven asset's growth is geopolitical and economic uncertainty along with regulators' monetary policy actions.
The price of gold is breaking records, reaching a new all-time high at 2195.17. The asset's quotes will likely correct after another small upward impulse in the next quarter. In the second half of the year, the gold price is expected to rise further and update its high.
Gold has grown by more than 10% since the beginning of 2024, rewriting an all-time high at 2195.17. Investors actively use the asset to protect their capital amid emerging global conflicts. The positive trend will likely continue in the next few years.
The key support level for the precious metal is $2,000 per ounce. The price of gold is unlikely to fall below this level in the foreseeable future.
Experts say the average gold price will be $3,863 per troy ounce at the end of 2029.
According to analytical agencies' forecasts, the average price of the precious metal will be about $5,678 per ounce at the end of 2034.
The main reasons for the growth of gold prices are macroeconomic factors, a tense geopolitical situation, global inflation, high interest rates, and monetary tightening.
Price chart of XAUUSD in real time mode

The content of this article reflects the author’s opinion and does not necessarily reflect the official position of LiteFinance. The material published on this page is provided for informational purposes only and should not be considered as the provision of investment advice for the purposes of Directive 2004/39/EC.