


GOLD, XAU/USD, US DOLLAR, CRUDE OIL, US CPI - Talking Points
- Gold has broken out of a recent range but has more hurdles ahead
- Treasury yields and USD movements are playing a larger hand again
- Energy and industrial metals are roaring higher. Will gold join the party?

The price of gold moved higher as the US Dollar sold off post US CPI yesterday. The headline CPI number was only marginally higher than expectations, clocking in at 0.4% m/m for September against 0.3% anticipated. The Core CPI print was in line at 0.2% m/m.
The language from the FOMC minutes was more intriguing. If there was any doubt about tapering starting in November or December, they have been dispensed baring a disaster in the interim. This led to Treasury yields going lower and the US Dollar going with it against most assets, including gold.
Energy commodity prices have made record highs in many markets recently. Industrial metals have also seen much higher prices, with the exception or iron ore. Aluminium, copper and steel are trading at multi-year highs.
Gold and silver have been left to their own devices to an extent as they are trading a long way below their highs seen last year. USD weakening appears to be the key culprit in favour of the precious metals.
Looking ahead, the Fed might be the key to gold price movements as the impact on the US Dollar appears to be the XAU driver for now.
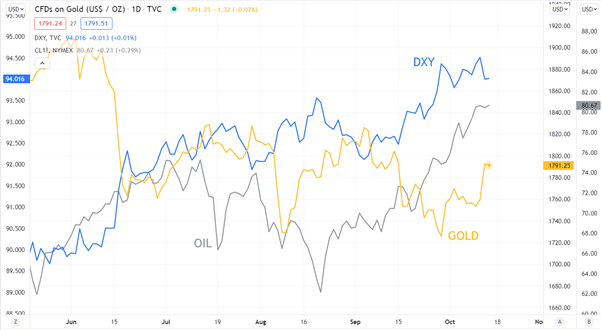
The chart below illustrates energy proxied by WTI crude oil and the US Dollar represented by the DXY USD index.
GOLD AGAINST CRUDE OIL AND USD

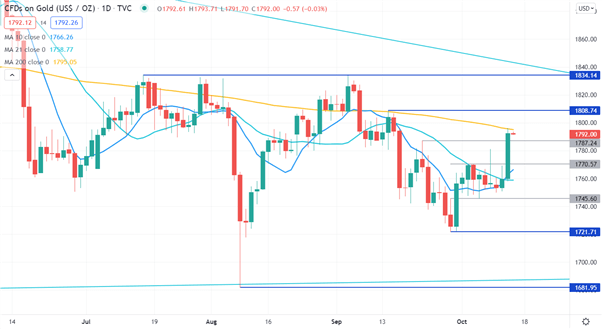
GOLD TECHNICAL ANALYSIS
Gold moved higher as the USD broke down yesterday. The rally broke through 2 resistance levels that might now provide support at 1787.24 and 1770.57. Below those levels are a pivot point at 1745.60 and a previous low at 1721.71 that could be support. Further down, the lower bound of the 4-month range at 1681.95 is a potential support level.
The move higher also brought the 10-day simple moving average (SMA) above the 21-day SMA for a very short term Golden Cross. Gold stalled at the 200-day SMA and this may be a resistance level.
Further to the topside, a previous high at 1808.74 is a possible resistance level and the upper bound of the 4-month range at a previous high of 1834.14 might offer resistance.
--- Written by Daniel McCarthy, Strategist for DailyFX.com
To contact Daniel, use the comments section below or @DanMcCathyFX on Twitter


