
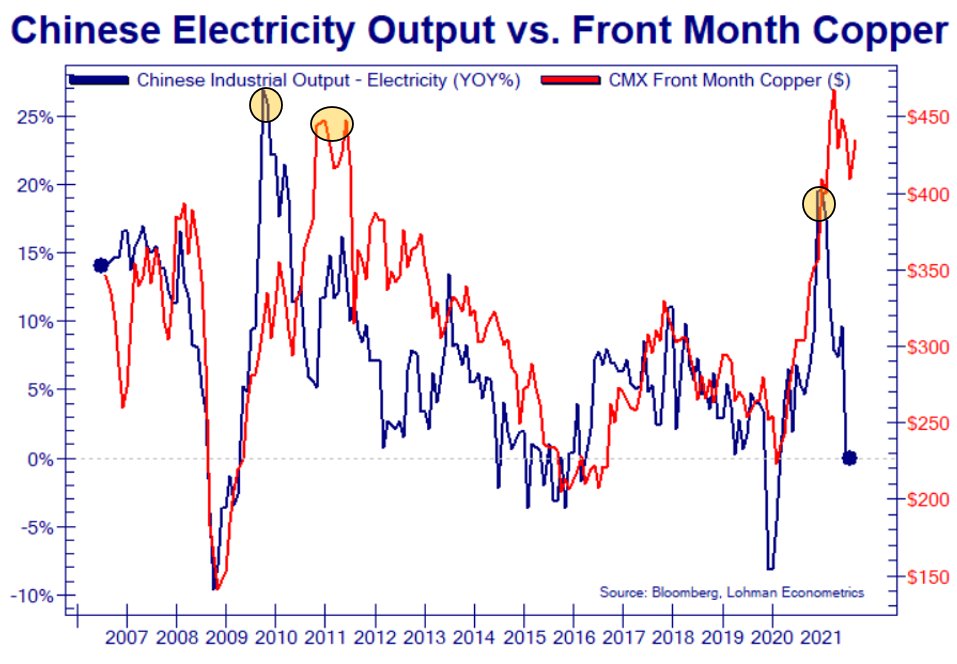
The cyclicality of Chinese electricity output is shown below year over year in blue since 2006. Now in a significant cyclical (and secular) decline, China’s economy has major implications for industrial commodities like copper (in red), which spiked from March 2020 to March 2021 on unprecedented cash injections into households, businesses and financial intermediaries globally. The mean reversion in Dr. copper (the Ph.D. in economics) and many other economically sensitive commodities is likely just begun.
 At the same time, global economic growth peaked in the second quarter of 2021 and has turned lower since. The I.M.F.’s latest update estimates 2022 global economic growth will be 17% lower than in 2021.
As shown below in blue, an optimistic consensus forecast for U.S. G.D.P. began June above 7%, before dipping to 5% in September. The Atlanta Fed GDPNow forecast began August above 6% and is now tracking at 1.3% (in green).
As shown below (upper panel), financial market optimism also appears to have peaked with parabolic stock prices in the second quarter.
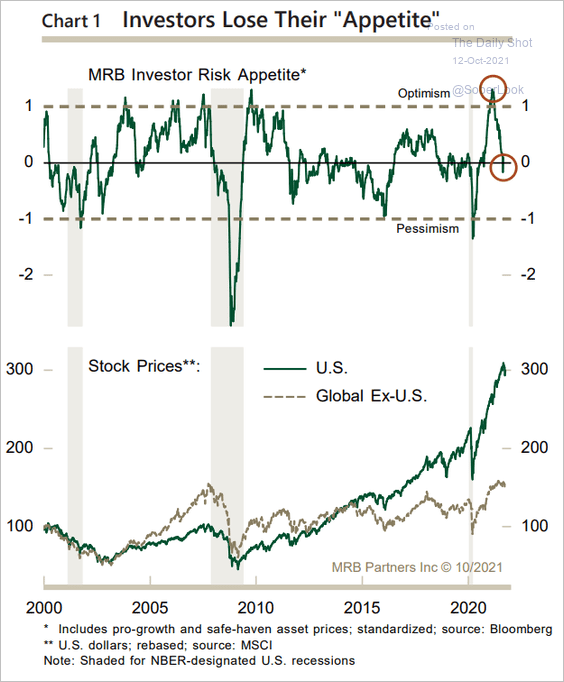 In the lower panel, we see that global stock prices, ex the U.S. in brown since 2000, have rolled over near their 2008 cycle highs once more. This is how secular bears move. Only when valuations have collapsed back below long-term means and laboured there long enough to crush animal spirits does the next secular expansion begin from the ashes of investor pessimism.
We also can see that U.S. stocks (lower panel in green) have so disconnected into a world of their own dreaming that a 30% retracement from present levels would not even violate their 2009 uptrend. History suggests that a loss of twice that much is likely.
