- Gold consolidates weekly losses, holds onto recovery moves from two-week low.
- Sentiment stays mildly upbeat amid stimulus hopes, easing covid woes and positive vaccine updates.
- ECB turned out a dull affair, preliminary PMIs for July will be the key ahead of next week’s FOMC.
- Gold Weekly Forecast: Possible correction to $1,800 as key resistance holds
Update: Gold price has returned to the red zone once again after a temporary reversal seen on Thursday, as a test of the sub-$1800 levels keeps calling. Gold price is holding the lower ground while approaching the $1800 mark, as the US dollar catches a fresh bid amid a mixed action in the Asian equities. Covid concerns remain unabated in Asia-pac region lifting the safe-haven demand for the greenback. Interestingly, the US Treasury yields remain at higher levels, courtesy of the stimulus optimism, which continue exert downside pressure on gold price. US President Joe Biden’s infrastructure bill is likely to come through on Monday after the debate got voted out on Wednesday.
On the economic data front, all eyes remain on the Eurozone and US Preliminary Manufacturing and Services PMIs for fresh hints on the global economic recovery, which could have a significant impact on the risk sentiment and, in turn, gold price.
Read: Gold Technical Analysis Elliott Wave [Video]
Gold (XAU/USD) edges higher around $1,808, up 0.07% intraday, while extending the bounce off a two-week low during Friday’s Asian session. Improving market sentiment seems to help the gold buyers to retake controls inside a bullish chart pattern, falling wedge, of late.
Behind the moves could be the US policymakers concerning the US President Joe Biden’s infrastructure spending bill’s passage, despite being rejected for opening debate. On the same line was the relief to lawmakers offered by the US Congressional Budget Office (CBO) when it said, per Bloomberg, “US lawmakers likely have until October or November to raise or suspend the debt limit.” This will help the diplomats to have a bit more time than the July 31 deadline when the debt limit will need a change from the $22 trillion level set in 2019.
Also positive for the mood could be the latest covid updates from Australia suggesting a lower count in Victoria. Additionally, the US vaccine panel’s support for COVID-19 booster shots also favors the sentiment.
It’s worth mentioning that the ECB’s dovish tilt and the US dollar’s recently lackluster moves, coupled with off in Japan and a light calendar elsewhere, add to gold’s short-term upside.
Amid these plays, S&P 500 Futures print 0.23% intraday gains after Wall Street benchmarks closed positive for the third day in a row, grinding lower though.
Looking forward, market players will keep their eyes on the first readings of July’s activity numbers from the key Western players, namely the UK, the US and the European Union (EU). Although the readings won’t be a big surprise if marking a lower count, due to the virus resurgence, any strong positive beat will be welcomed by the gold buyers with zeal.
Read: US Markit PMIs Preview: Pre-weekend dollar boost? Downbeat figures could exacerbate risk-off mood
Technical analysis
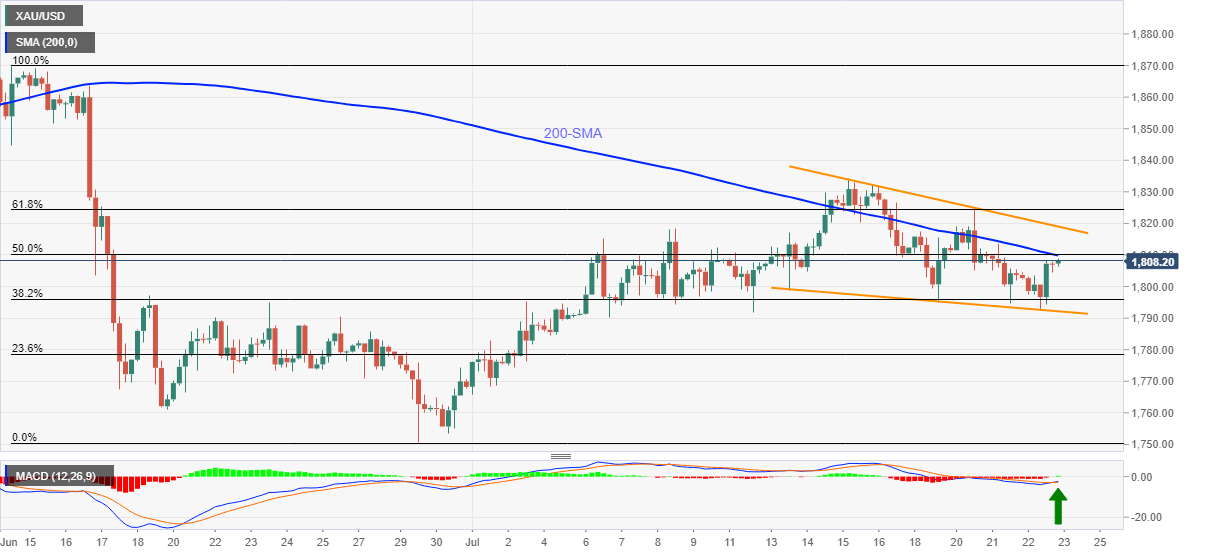
Gold prices stay on the way to $1,810 resistance confluence comprising 200-SMA and 50% Fibonacci retracement of June’s fall.
With the MACD line teasing bullish cross over the signal line, the upside momentum may gain traction should the commodity manages a clear break of the nearby key hurdle.
However, the resistance line of a two-week-old falling wedge bullish chart pattern and 61.8% Fibonacci retracement (Fibo.), respectively around $1,819 and $1,825, not to forget the monthly peak of $1,834, will be crucial to watch going further north.
On the contrary, pullback moves may re-test the $1,800 round figure before dropping back to the 38.2% Fibo. level surrounding $1,796.
During the quote’s weakness past $1,796, the lower line of the stated wedge near $1,792 will challenge the gold sellers.
Gold: Four-hour chart
Trend: Further recovery expected
Information on these pages contains forward-looking statements that involve risks and uncertainties. Markets and instruments profiled on this page are for informational purposes only and should not in any way come across as a recommendation to buy or sell in these assets. You should do your own thorough research before making any investment decisions. FXStreet does not in any way guarantee that this information is free from mistakes, errors, or material misstatements. It also does not guarantee that this information is of a timely nature. Investing in Open Markets involves a great deal of risk, including the loss of all or a portion of your investment, as well as emotional distress. All risks, losses and costs associated with investing, including total loss of principal, are your responsibility. The views and opinions expressed in this article are those of the authors and do not necessarily reflect the official policy or position of FXStreet nor its advertisers. The author will not be held responsible for information that is found at the end of links posted on this page.
If not otherwise explicitly mentioned in the body of the article, at the time of writing, the author has no position in any stock mentioned in this article and no business relationship with any company mentioned. The author has not received compensation for writing this article, other than from FXStreet.
FXStreet and the author do not provide personalized recommendations. The author makes no representations as to the accuracy, completeness, or suitability of this information. FXStreet and the author will not be liable for any errors, omissions or any losses, injuries or damages arising from this information and its display or use. Errors and omissions excepted.
The author and FXStreet are not registered investment advisors and nothing in this article is intended to be investment advice.
Recommended content
Editors’ Picks
AUD/USD could extend the recovery to 0.6500 and above

The enhanced risk appetite and the weakening of the Greenback enabled AUD/USD to build on the promising start to the week and trade closer to the key barrier at 0.6500 the figure ahead of key inflation figures in Australia.
EUR/USD now refocuses on the 200-day SMA

EUR/USD extended its positive momentum and rose above the 1.0700 yardstick, driven by the intense PMI-led retracement in the US Dollar as well as a prevailing risk-friendly environment in the FX universe.
Gold struggles around $2,325 despite broad US Dollar’s weakness

Gold reversed its direction and rose to the $2,320 area, erasing a large portion of its daily losses in the process. The benchmark 10-year US Treasury bond yield stays in the red below 4.6% following the weak US PMI data and supports XAU/USD.
Bitcoin price makes run for previous cycle highs as Morgan Stanley pushes BTC ETF exposure

Bitcoin (BTC) price strength continues to grow, three days after the fourth halving. Optimism continues to abound in the market as Bitcoiners envision a reclamation of previous cycle highs.
US versus the Eurozone: Inflation divergence causes monetary desynchronization

Historically there is a very close correlation between changes in US Treasury yields and German Bund yields. This is relevant at the current juncture, considering that the recent hawkish twist in the tone of the Federal Reserve might continue to push US long-term interest rates higher and put upward pressure on bond yields in the Eurozone.