


Gold Technical Price Outlook: XAU/USD Near-term Trade Levels
- Gold price updated technical trade levels – Daily & Intraday Charts
- XAU/USD sets monthly opening-range below technical resistance at 1918/22
- New to Gold Trading? Get started with this Free How to Trade Gold -Beginners Guide
Gold prices are virtually unchanged since the start of the week with XAU/USD recouping early losses on the heels of today’s US Inflation data release. While the broader outlook remains constructive, the April rally may yet be vulnerable while below technical resistance just higher and our immediate focus is on a break of the monthly opening-range for guidance. These are the updated targets and invalidation levels that matter on the XAU/USD technical charts. Review my latest Strategy Webinar for an in-depth breakdown of this gold technical setup and more.
Gold Price Chart - XAU/USD Daily
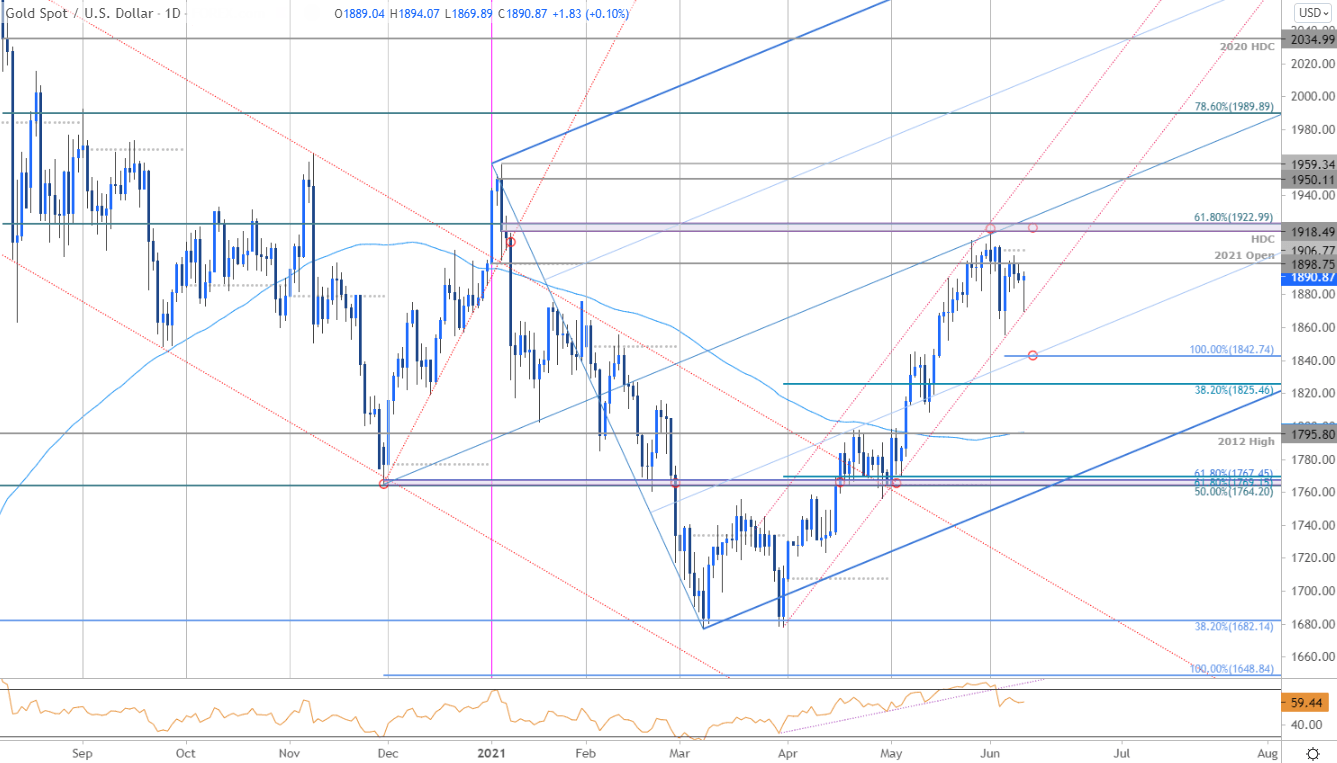
Chart Prepared by Michael Boutros, Technical Strategist; Gold on Tradingview
Technical Outlook: In my last Gold Price Outlook we noted that a breakout in XAU/USD kept the, “focus on subsequent resistance objectives at the yearly open / 78.6% retracement at 1898 backed by the yearly high-day close / 2011 high / 61.8% Fibonacci retracement at 1918/23- both levels of interest for possible topside exhaustion IF reached.” Gold registered a high at 1916 before marking an outside-day reversal off slope resistance into the open of June trade. A decline of more than 3% rebounded just ahead of channel support last week with the monthly opening-range now set just below key resistance.
Gold Price Chart - XAU/USD 120min
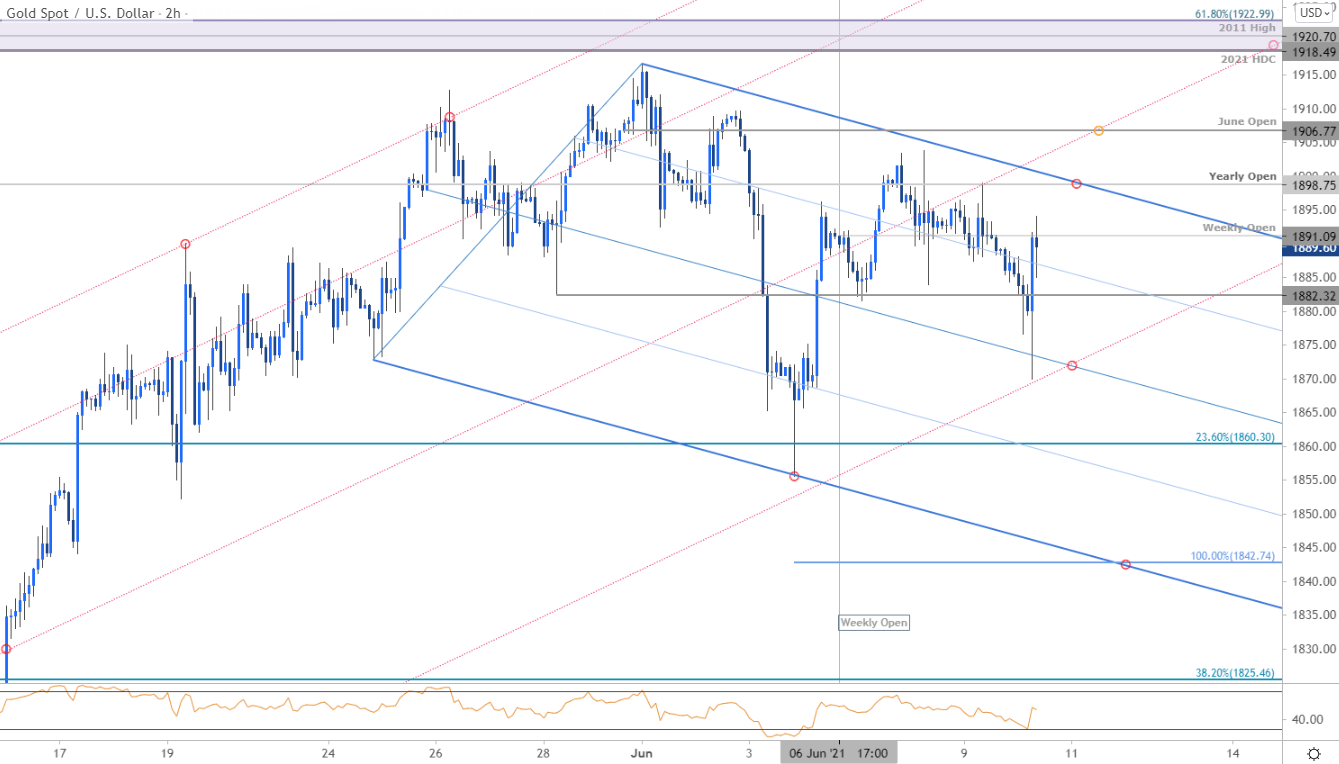
Notes: A closer look at Gold price action shows XAU/USD trading within the confines of a descending pitchfork formation with initial resistance eyed at the upper parallel / 2021 yearly-open at 1898. Look for a reaction there IF reached with a topside breach exposing the monthly open at 1906 and key resistance at 1918/23 – a weekly close above this threshold would be needed to mark resumption of the broader uptrend towards the yearly high-close at 1950. Support rests at the highlighted trendline confluence around ~1870s – a break / close below this threshold would suggest a larger correction is underway with subsequent support objectives eyed at 1860 and the 100% extension of the monthly decline at 1842 (an area of interest for possible downside exhaustion IF reached).

Bottom line: The gold monthly opening-range is set just below confluence resistance – breakout to offer guidance. From at trading standpoint, look for downside exhaustion ahead of today’s lows IF price is indeed heading higher with a breach / close above 1923 needed to fuel the next leg higher in price. Ultimately, a break below lower would threaten a deeper correction towards the confluence support at the lower parallel / 1842. Review my latest Gold Weekly Price Outlook for a closer look at the longer-term XAU/USD technical trading levels.
For a complete breakdown of Michael’s trading strategy, review his Foundations of Technical Analysis series on Building a Trading Strategy
Gold Trader Sentiment – XAU/USD Price Chart
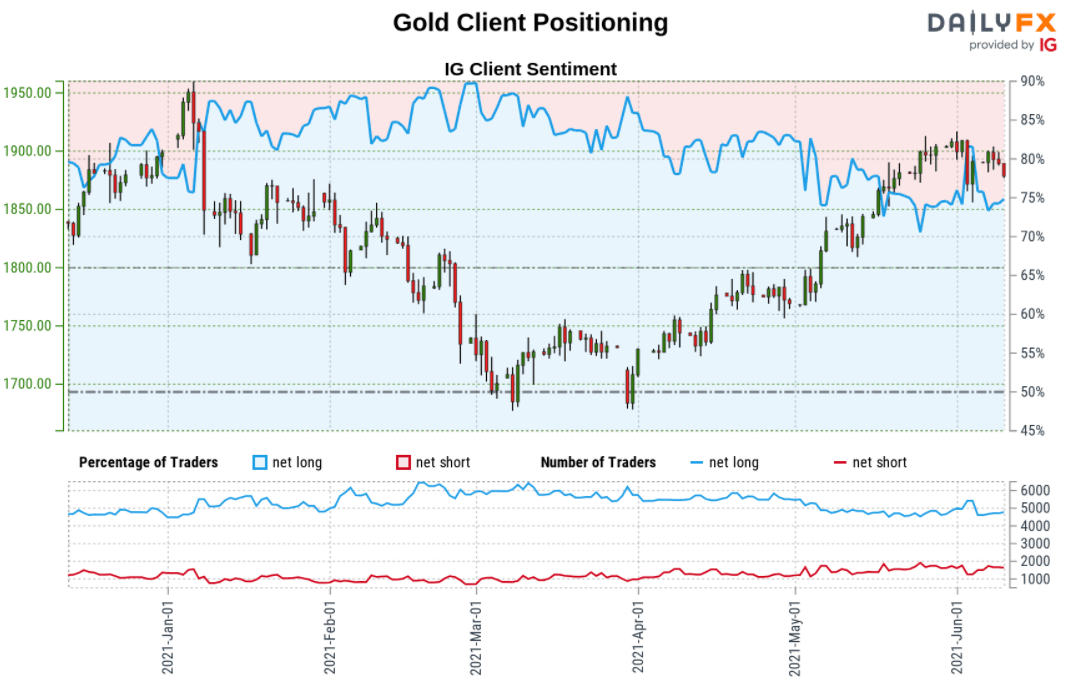
- A summary of IG Client Sentiment shows traders are net-long Gold- the ratio stands at +3.01 (75.09% of traders are long) – typically bearishreading
- Long positions are0.83% lower than yesterday and 8.17% lower from last week
- Short positions are4.36% lower than yesterday and 5.84% lower from last week
- We typically take a contrarian view to crowd sentiment, and the fact traders are net-long suggests Gold prices may continue to fall. Traders are more net-long than yesterday but less net-long from last week. The combination of current positioning and recent changes gives us a further mixed Gold trading bias from a sentiment standpoint.
| Change in | Longs | Shorts | OI |
| Daily | -4% | 3% | 0% |
| Weekly | -2% | 5% | 1% |
---
Active Technical Setups
- Bitcoin (BTC/USD) Outlook: Bitcoin Post-Collapses Counter-Offensive
- Canadian Dollar Outlook: USD/CAD at Support- Loonie Breakout Imminent
- Euro Price Outlook: EUR/USD Rips into Yearly Open Resistance
- Oil Price Outlook: Crude Surges- Bulls Eye Major Breakout at May High
- Written by Michael Boutros, Technical Strategist with DailyFX
Follow Michael on Twitter @MBForex


