
Advertisement
Advertisement
Traders Await Thursday’s Consumer Price Index Numbers
By:
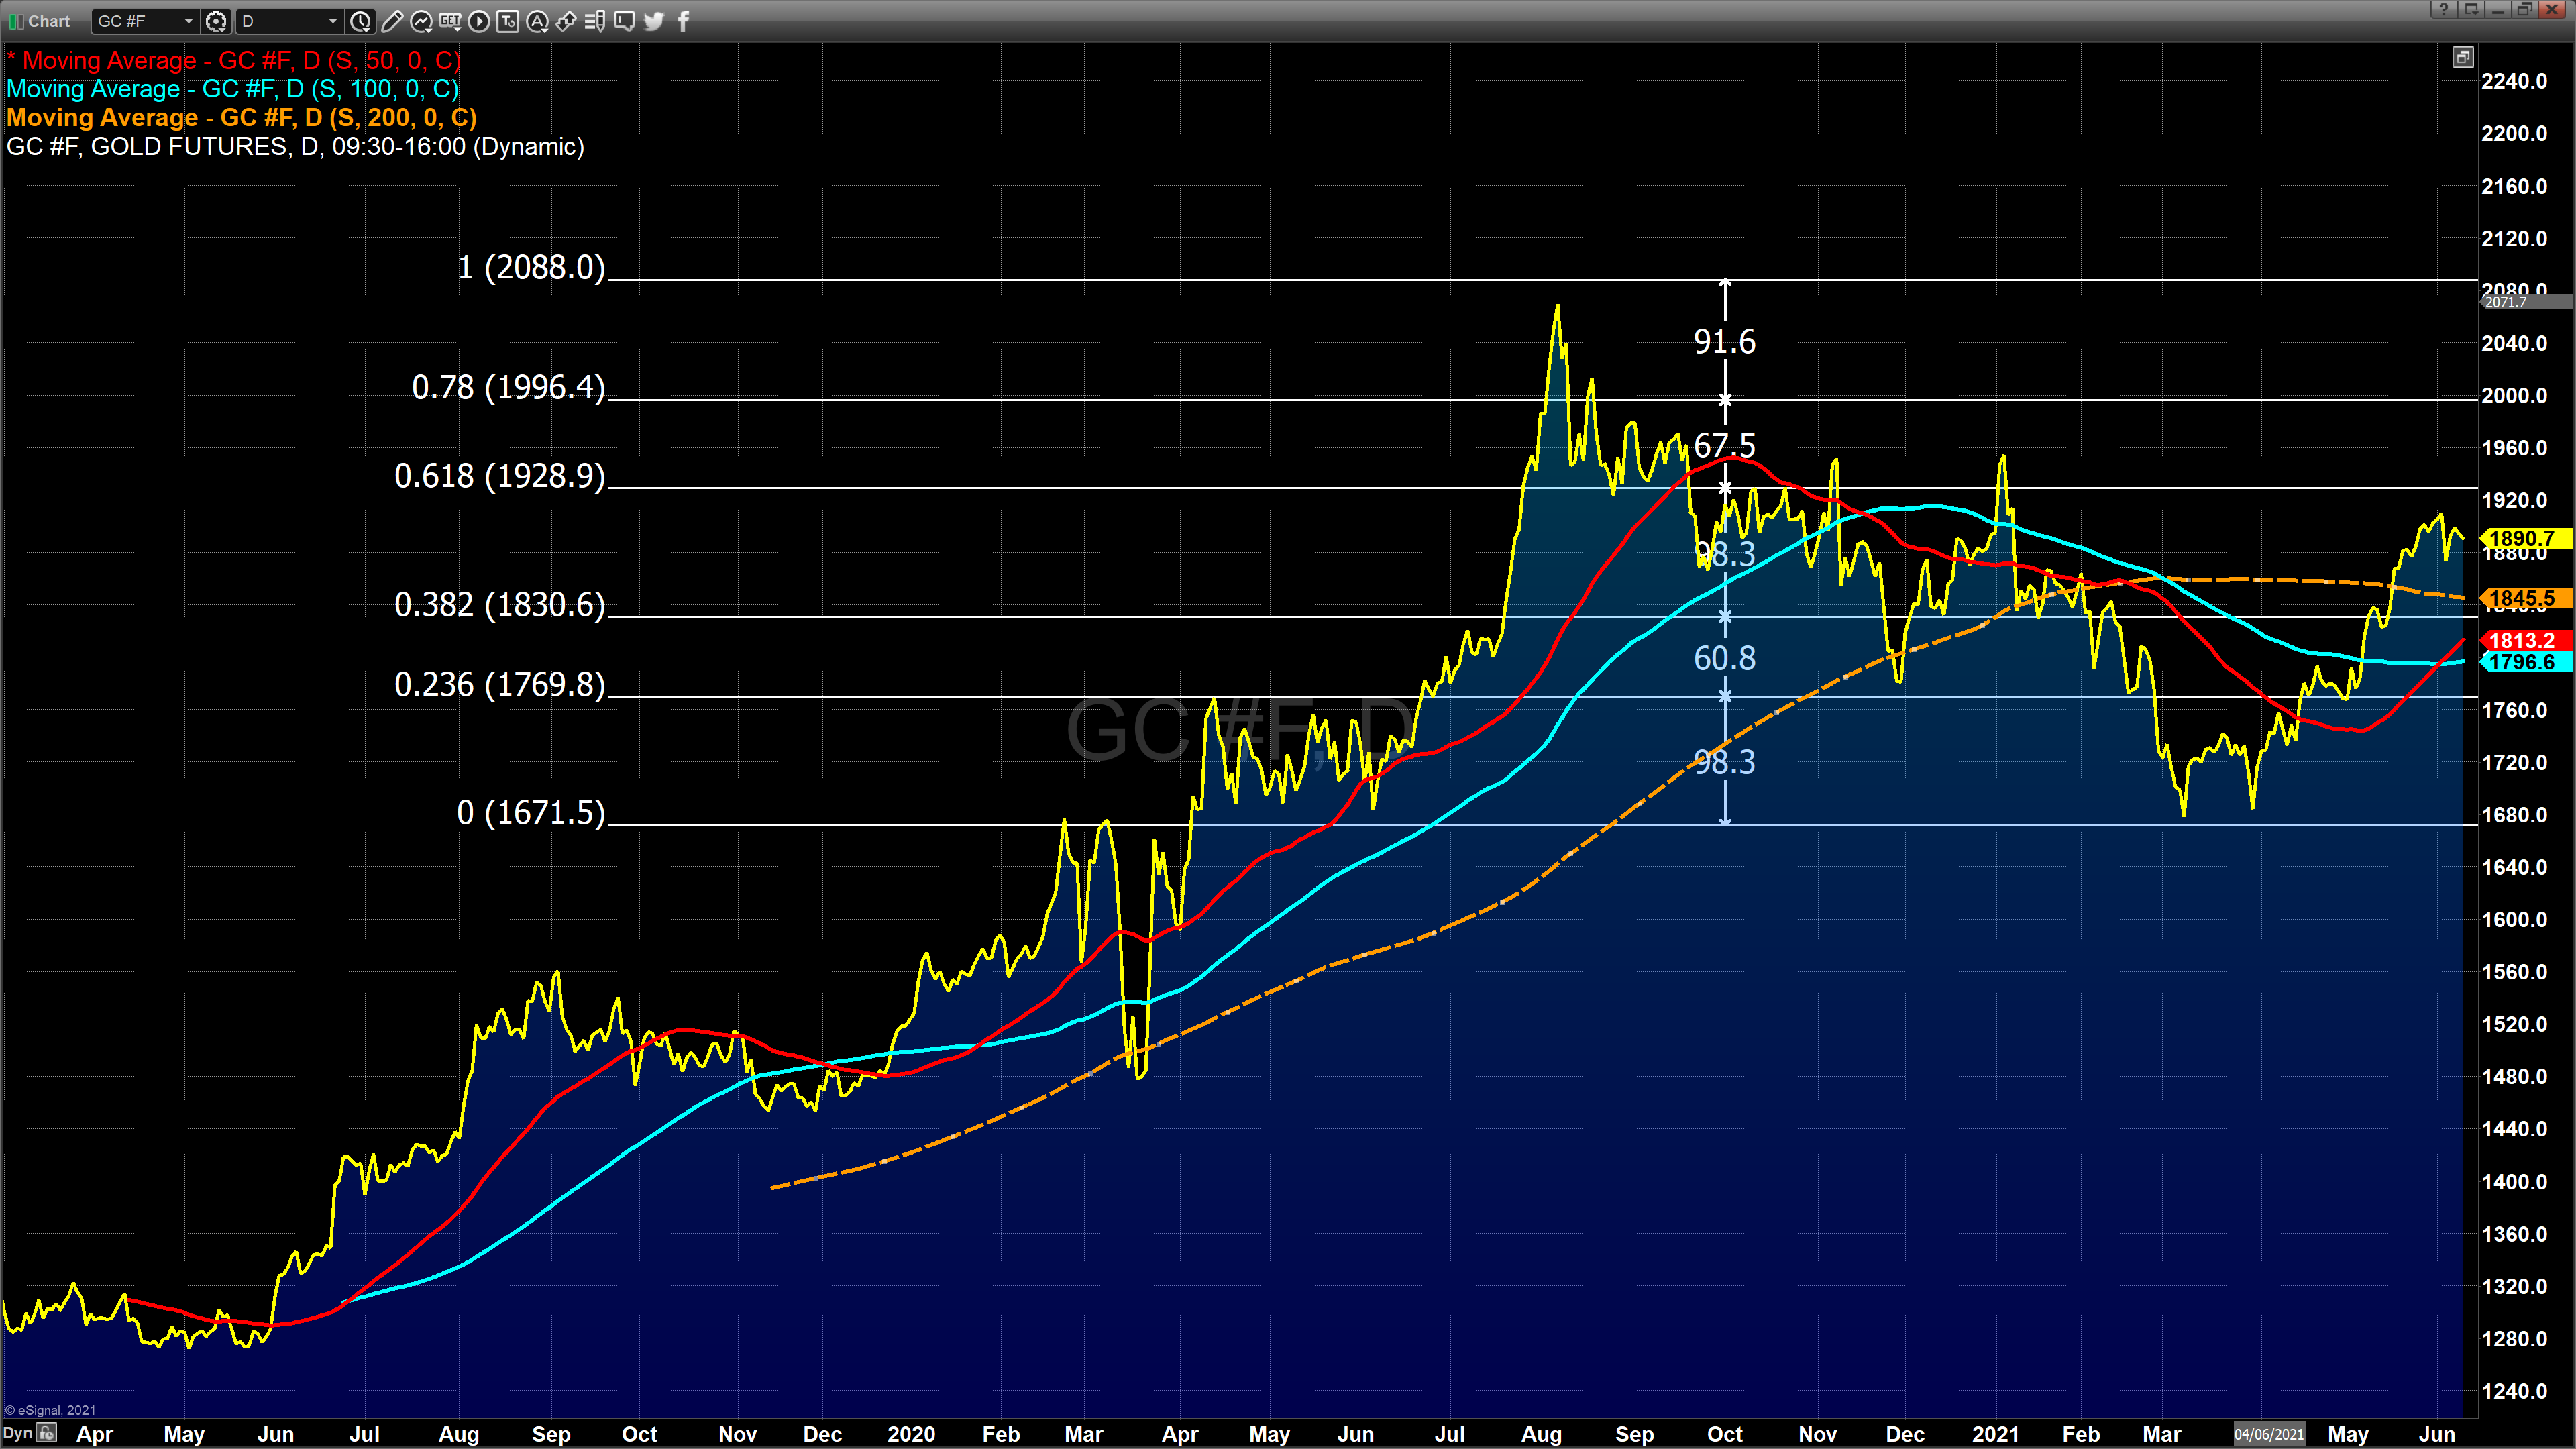
Gold has been moving in a defined but exaggerated range between $1855 and $1910 over the last week.
Although gold closed fractionally higher in New York today, as of 5:35 PM EST, gold futures basis the most active August 2021 Comex contract is trading down $3.70, currently fixed at $1890.70.
The fact that gold is trading lower as we await tomorrow’s CPI (consumer price index) data is interesting. One would expect the current forecast expected to show an increase from last month’s numbers taking the annualized inflation rate close to 5% to be a bullish influence on gold pricing. However, based on current pricing, that is not the case. One possible explanation is that analysts, economists, and investors believe that the recent surge in inflationary pressure could be temporary rather than sticky (sustained). The CPI report continues to be the main tool used by the government to track current inflationary pressures.
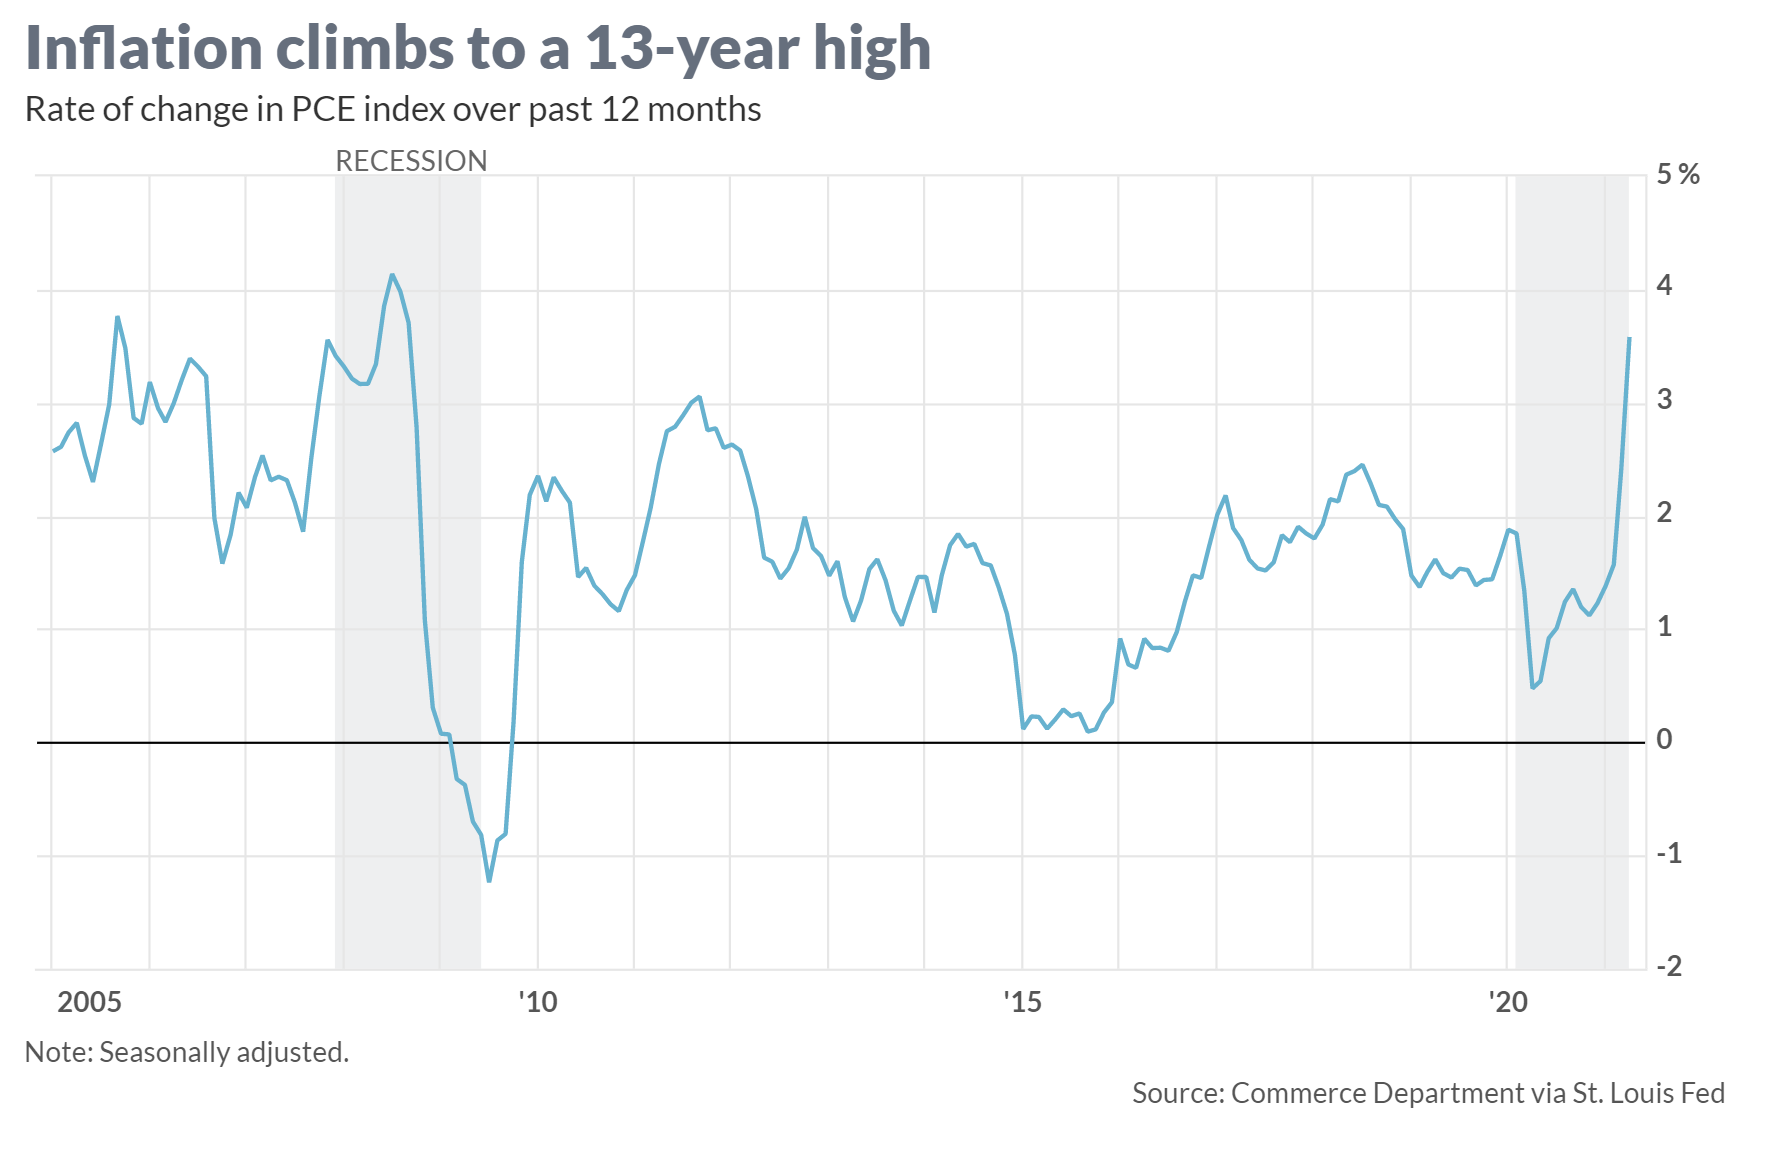
Unquestionably the cost of goods and services needed for day-to-day living has been on the rise. According to the seasonally adjusted rate of change in the PCE index is at a 13 year high. The last occurrence of inflationary pressures at this level was during the recession of 2009, which was slightly higher than our current inflationary rate.
The largest price increases for goods and services continue to be the cost of oil (gas) and food. These increases are the direct result of many companies lowering production, as well as a dramatic disruption of global trade due to the contracting economies, which are a direct result of the pandemic.
According to MarketWatch, “The more critical question is whether inflation continues to wane in 2022. The Federal Reserve, the nation’s inflation watchdog, has insisted for months that the surge in inflation is temporary. The central bank predicts inflation will slow to a 2% annual rate by next year, using its preferred PCE price gauge. In the Fed’s view, almost the entire increase in inflation reflects the lingering effects of the pandemic and a full reopening on the economy.”
Our technical studies are indicating that there is real resistance for gold to move above $1900 on a sustained and closing basis. Concurrently the studies are indicating that there is strong support for gold at $1845.50, which is the current price of the 200-day moving average. Another noteworthy aspect is that the golden cross that was created on May 24 when the 50-day moving average crossed above the 100-day moving average continues to widen, which indicates that there is still bullish market sentiment. Coupled with the fact that gold prices have remained above the 200-day moving average since May 17, confirm that the volatility seen within gold pricing over the last week did not result in any major technical chart damage.
For those who want more information, please use this link.
Wishing you, as always, good trading and good health,
Gary S. Wagner
About the Author
Gary S.Wagnercontributor
Gary S. Wagner has been a technical market analyst for 35 years. A frequent contributor to STOCKS & COMMODITIES Magazine, he has also written for Futures Magazine as well as Barron’s. He is the executive producer of "The Gold Forecast," a daily video newsletter. He writes a daily column “Hawaii 6.0” for Kitco News
Did you find this article useful?
Latest news and analysis


Advertisement