

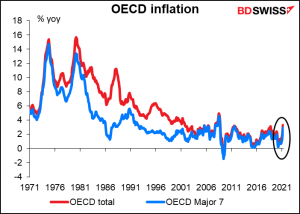
Thursday’s US consumer price index (CPI) for May will be perhaps the most closely watched indicator so far this year. The big question facing the financial markets nowadays is: is the decades-long structural decline in inflation over? Because if it is, it will be a very different background for financial markets. The tailwind that we’ve enjoyed for a long time will turn into a headwind just as central banks are faced with the problem of supporting the recovery and dealing with unprecedented levels of government debt.
The US CPI is not the Fed’s preferred inflation gauge – the Fed has been framing its inflation forecasts in terms of the personal consumption expenditure (PCE) deflator since 2000. However, it is the market’s preferred inflation gauge. The Bloomberg relevance score for the month-on-month change in the CPI is 96.1, meaning about 96% of the people who have any alerts set for US indicators have an alert set for this indicator. The only indicators with a higher score than the CPI are nonfarm payrolls (99.2), initial jobless claims (98.4), and GDP (96.9). By contrast, the highest figure for any of the PCE deflators is 60.1 for the month-on-month change in the core deflator. That’s quite low. I’m at a loss to explain why the market places so much more weight on the CPI than on the PCE deflator – maybe it’s only nerds like me who care about the PCE deflator.
In any case, following April’s eye-popping 4.2% year-on-year print for the headline number, this month the market is expecting a jaw-dropping 4.7% yoy increase. That would be the fastest yoy rate of increase since September 2008. The expected 3.5% increase in core inflation would be the fastest since April 1993, when by the way the midpoint of the fed funds target range was 3%, not 0.125% as it is today.
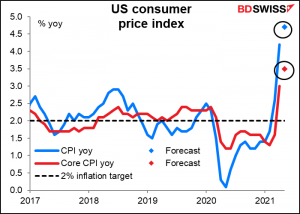
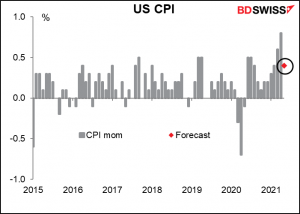
An argument could be made – and I’m sure will be made by some officials – that this is largely due to base effects. If we look at the mom rate of change, the expected +0.4% mom increase is nothing unusual. It would be down sharply from +0.8% mom in April and +0.6% mom in March.
The figure isn’t necessarily as important as how officials spin it. This week is difficult in that respect because Fed officials are in their “purdah” period when they’re not allowed to talk to the press ahead of the Federal Open Market Committee (FOMC) meeting next week. So, we won’t get any reassuring comments from officials to soothe the furrowed brows of traders.
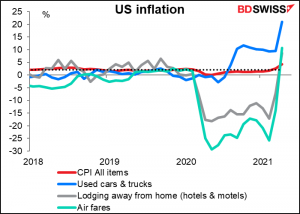
So far though the story that they’ve been telling seems to be largely correct: the higher inflation is mostly due to temporary supply/demand imbalances that occurred as the economy reopens and people go out and spend their stimulus payments. The poster boy for this phenomenon is used cars & trucks (blue line). During the pandemic, car rental companies reduced their fleets dramatically to conserve cash and stay in business (some failed anyway). Now that people are traveling again, they’re rushing to buy more cars. They’ve had to resort to buying used cars by the thousands, which has pushed up prices dramatically — +21% yoy. Similarly, airfares and hotel rates have risen sharply from a year ago (+10.7% yoy and +8.7% yoy, respectively) as more people are traveling but the industry hasn’t gotten its capacity back to where it was.
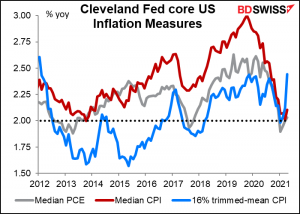
But these sorts of bottlenecks are temporary and limited to a few sectors. If we eliminate the more exaggerated price movements, as the “median” and “trimmed mean” measures calculated by the Cleveland Fed do, we get inflation that’s not all that high — 2.0% to 2.4% yoy. This is probably why the Fed can continue to be optimistic about the rise in inflation being only “temporary” and “transitory.”
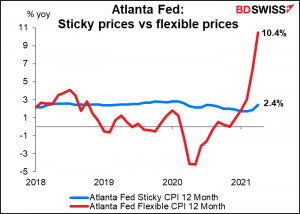
Similarly, the Atlanta Fed produces an index of prices of products with “sticky” prices (goods that change price less often than every 4.3 months) and “flexible” prices (those that change more frequently). About half of the flexible-price CPI comprises food and energy goods, the remainder being largely autos, apparel, and lodging away from home.
The researchers who compiled the data argue that the “sticky” price is a better forecaster of future inflation than the “flexible” price.
While a sticky price may not be as responsive to economic conditions as a flexible price, it may do a better job of incorporating inflation expectations. Since price setters understand that it will be costly to change prices, they will want their price decisions to account for inflation over the periods between their infrequent price changes.
All told, I think it’s too early to worry about a permanent, secular rise in inflation. I’m confident that accelerating technological progress and the expansion of global trade will continue to keep inflation low. Nonetheless, it’s clear that there will at least be a temporary increase in inflation and many investors are likely to hedge against this prospect. That’s why the CPI figures are going to be crucial for the markets for the next few months.


