


Gold (XAU/USD) Analysis, Price and Chart
- Gold sticking to Fibonacci and moving average guidelines.
- US Treasury yields may have dipped but they look set to move back higher.

For all market-moving events and data releases, see the DailyFXCalendar
The price of gold is currently pushing towards a clutch of resistance levels after making a strong rebound over the last week. Support around the $1,675/oz. area held, aided by the 61.8% Fibonacci retracement level at $1,689/oz. and the subsequent rally has the precious metal nearing a cluster of resistance levels which may prove difficult to overcome.
One of the main drivers of the recent sell-off in gold has been the ongoing rise in US Treasury yields as the market continues to price in the inflationary effect of the US fiscal and monetary largesse. After hitting a recent 14-month of 1.75%, the yield on the 10-year UST has faded 10bps to currently trade at 1.65%. This move enabled gold to bounce back. The move lower in UST yields is unlikely to continue and a reversal higher is seen as when, not if, as the US spends heavily to fully re-boot its economy and drive down unemployment. Recent US data continues to point to faster than forecast economic expansion and if inflation is to be kept under control, higher interest rates will be needed, and maybe sooner than expected.
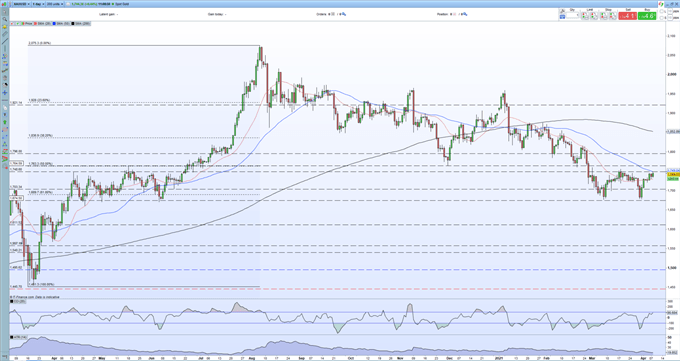
Looking at the daily gold chart, the precious metal is currently trapped between the 20- and 50-day simple moving averages, with a break higher expected to run into resistance at $1,756/oz. (March 18 high), before $1,760/oz. (March 1 high) and the 50% Fibonacci retracement at $1,763/oz. The CCI reading shows gold nudging overbought territory and at its highest level since early January. It looks as though gold is going to need a fundamental push to break through these technical levels. It is also noticeable that retail customers have increased their net-short positions substantially over the last week, selling into the rally – see below.
Gold Daily Price Chart (March 2020 – April 8, 2021)
| Change in | Longs | Shorts | OI |
| Daily | -1% | -2% | -2% |
| Weekly | 7% | -10% | -2% |
Client sentiment data show 80.18% of traders are net-long with the ratio of traders long to short at 4.05 to 1.The number of traders net-long is 0.60% lower than yesterday and 5.30% lower from last week, while the number of traders net-short is 4.16% higher than yesterday and 38.24% higher from last week.
We typically take a contrarian view to crowd sentiment, and the fact traders are net-long suggests Gold prices may continue to fall.Yet traders are less net-long than yesterday and compared with last week. Recent changes in sentiment warn that the current Gold price trend may soon reverse higher despite the fact traders remain net-long.
What is Market Sentiment and How Does it Work?
What is your view on Gold – are you bullish or bearish?? You can let us know via the form at the end of this piece or you can contact the author via Twitter @nickcawley1.


