Gold Prices Lead Interest Rates
Free Chart In Focus email
Delivered to you every week
Gold prices are important not just to traders of gold coins, but also as a great leading indicator of lots of things that will happen in the future. This week’s chart shows one of the messages we can take from gold prices, which concerns long-term interest rates.
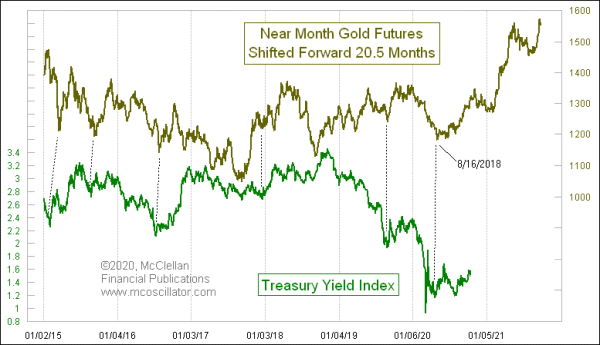
In this chart, the plot of gold prices has been shifted forward by 20-1/2 months, in order to help reveal how the dance steps that gold prices make tend to get repeated by long term interest rates. The Treasury Yield Index (TYX) is the current yield-to-maturity (YTM) on the most recently issued 30-year Treasury bond. For reasons that are not immediately clear, gold’s movements tend to show up again 20-1/2 months later in long term bond yields.
Why the lag is 20-1/2 months, I do not know. Our job is not to dictate to the markets what rules they ought to follow, but instead to use the data we have available to figure out what the market’s rules are. We don’t get to tell an electron what its mass should be. Nor should we presume to tell interest rates that they should lag gold by a different amount of time.
The correlation of the two plots is far from perfect. And we should not expect perfection of prediction from a messenger sending its signal almost 2 years before. That there could be any correlation at all over such a time frame is amazing.
Here is a closer look at the immediate relationship between the two.
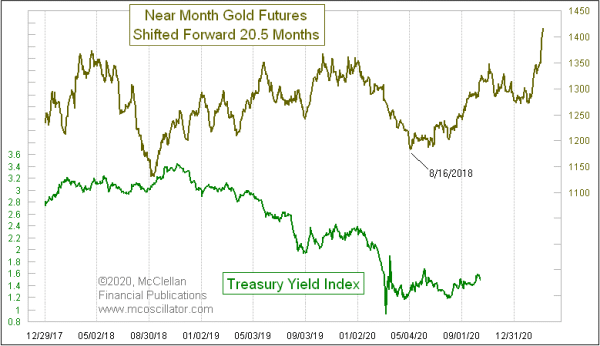
The Covid Crash was not really on the original schedule, or really any other schedule, and so we should not fault this model too much for missing that event in its predictions. Now that we are into the “clear air” and out of the turbulence of that event, the TYX is starting to correlate more closely again with what gold has said should be happening.
These charts do not show the full history of what gold has done most recently. That is intentional, so that we can focus on the immediate future for interest rates, without getting distracted by gold’s swoop up to above $2000. That swoop will matter several months from now, but is not a concern for the immediate future of interest rates.
What gold shows is an uptrend ahead for interest rates, and especially once we get into 2021. Rising interest rates mean falling bond prices, and so bond investors will want to pay attention to that message. The Fed’s efforts to stimulate economic growth have increased the supply of dollars, but have done nothing to the supply of gold. Every price is a ratio of dollars per stuff. If the stuff quantity stays the same (such as the amount of gold on the planet), and the supply of dollars goes up, it is natural to expect the dollars/stuff ratio to change.
The magic of the bond market is that such changes flow through eventually into interest rates, with about a 20-1/2 month lag. We are in for some interesting months ahead in the bond market.
Tom McClellan
Editor, The McClellan Market Report
Feb 20, 2020
It Takes 15 Months for Yield Curve Inversion To Be Felt |
Jul 07, 2016
NIRP Disrupting 60-Year Cycle |
Jan 09, 2019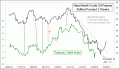
Crude Oil Leads Bond Yields |