


Gold Price, News and Chart:
- IMF warns on global growth, downgrades forecasts.
- China warns over US extradition demand.
Q1 2019 Gold Forecast and Top Trading Opportunities
Gold Back in Favor but $1,300/oz. Remains an Obstacle
Global growth fears and renewed US -China tension sent risk-adverse investors back into the sanctuary of Gold. Yesterday’s warning from the IMF that global growth was slowing, accompanied by downgrades from its October forecasts, cast a shadow over the WEF meeting in Davos, with the report highlighting ongoing trade tensions between the US and China as one of its biggest headwinds.
IMF Warns of Risks to Global Growth, Advanced Economies to Fall Sharply
Adding to the safe-haven bid, the US plans to proceed with extradition proceedings against Huawei CFO Sabrina Meng Wanzhou from Canada to answer charges of banking irregularities in violation of US sanctions against Iran. China responded saying that both Canada and the US should be aware of the seriousness of the case and ‘take steps to rectify the mistake’. With US-China trade talks at an impasse, and with little progress seen on the thorny intellectual property issue, trade tensions are likelyto increase in the short-term, boosting risk-haven assets including Gold, the Japanese Yen (JPY) and the Swiss Franc (CHF).
How to Trade Gold: Top Gold Trading Strategies and Tips
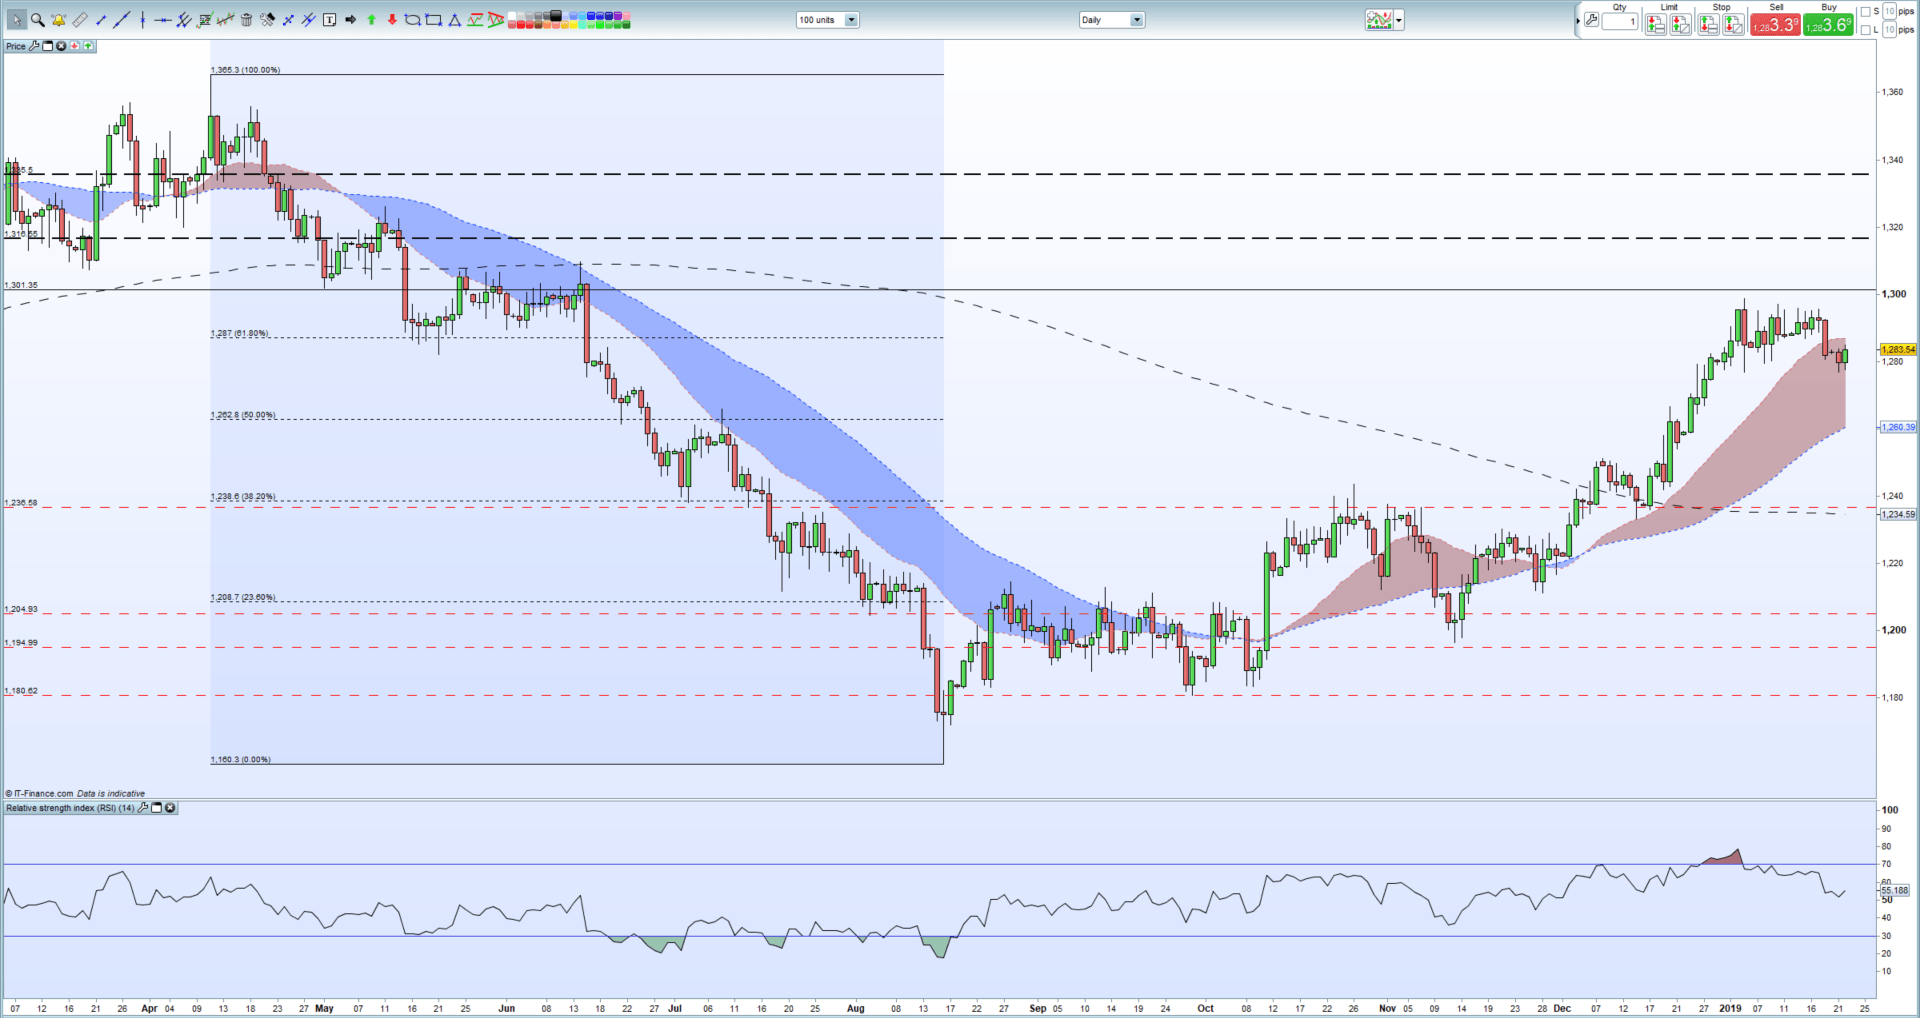
Gold now is stuck in a $1,275/oz. to $1,300/oz. range and needs further impulses to force a breakout. To the upside a break above $1,299/oz. would take the market back to levels last seen in mid-June last year, although the 61.8% Fibonacci retracement at $1,287/oz. will need to be broken cleanly again and closed above. To the downside, a break through the current range would target the 50% Fibonacci level at $1,262/oz. With current tensions and fears controlling market sentiment, a break higher looks more plausible in the short-term.
Gold Daily Price Chart (March 2018 – January 22, 2019)
Retail traders are 68% net-long US Crude according to the latest IC Client Sentiment Data, a bearish contrarian indicator. See how daily and weekly sentiment updates have an effect on our trading outlook.
Traders may be interested in two of our trading guides – Traits of Successful Traders and Top Trading Lessons – while technical analysts are likely to be interested in our latest Elliott Wave Guide.
What is your view on Gold – bullish or bearish?? You can let us know via the form at the end of this piece or you can contact the author at nicholas.cawley@ig.com or via Twitter @nickcawley1.


