
Advertisement
Advertisement
Gold Price Futures (GC) Technical Analysis – January 10, 2019 Forecast
By:
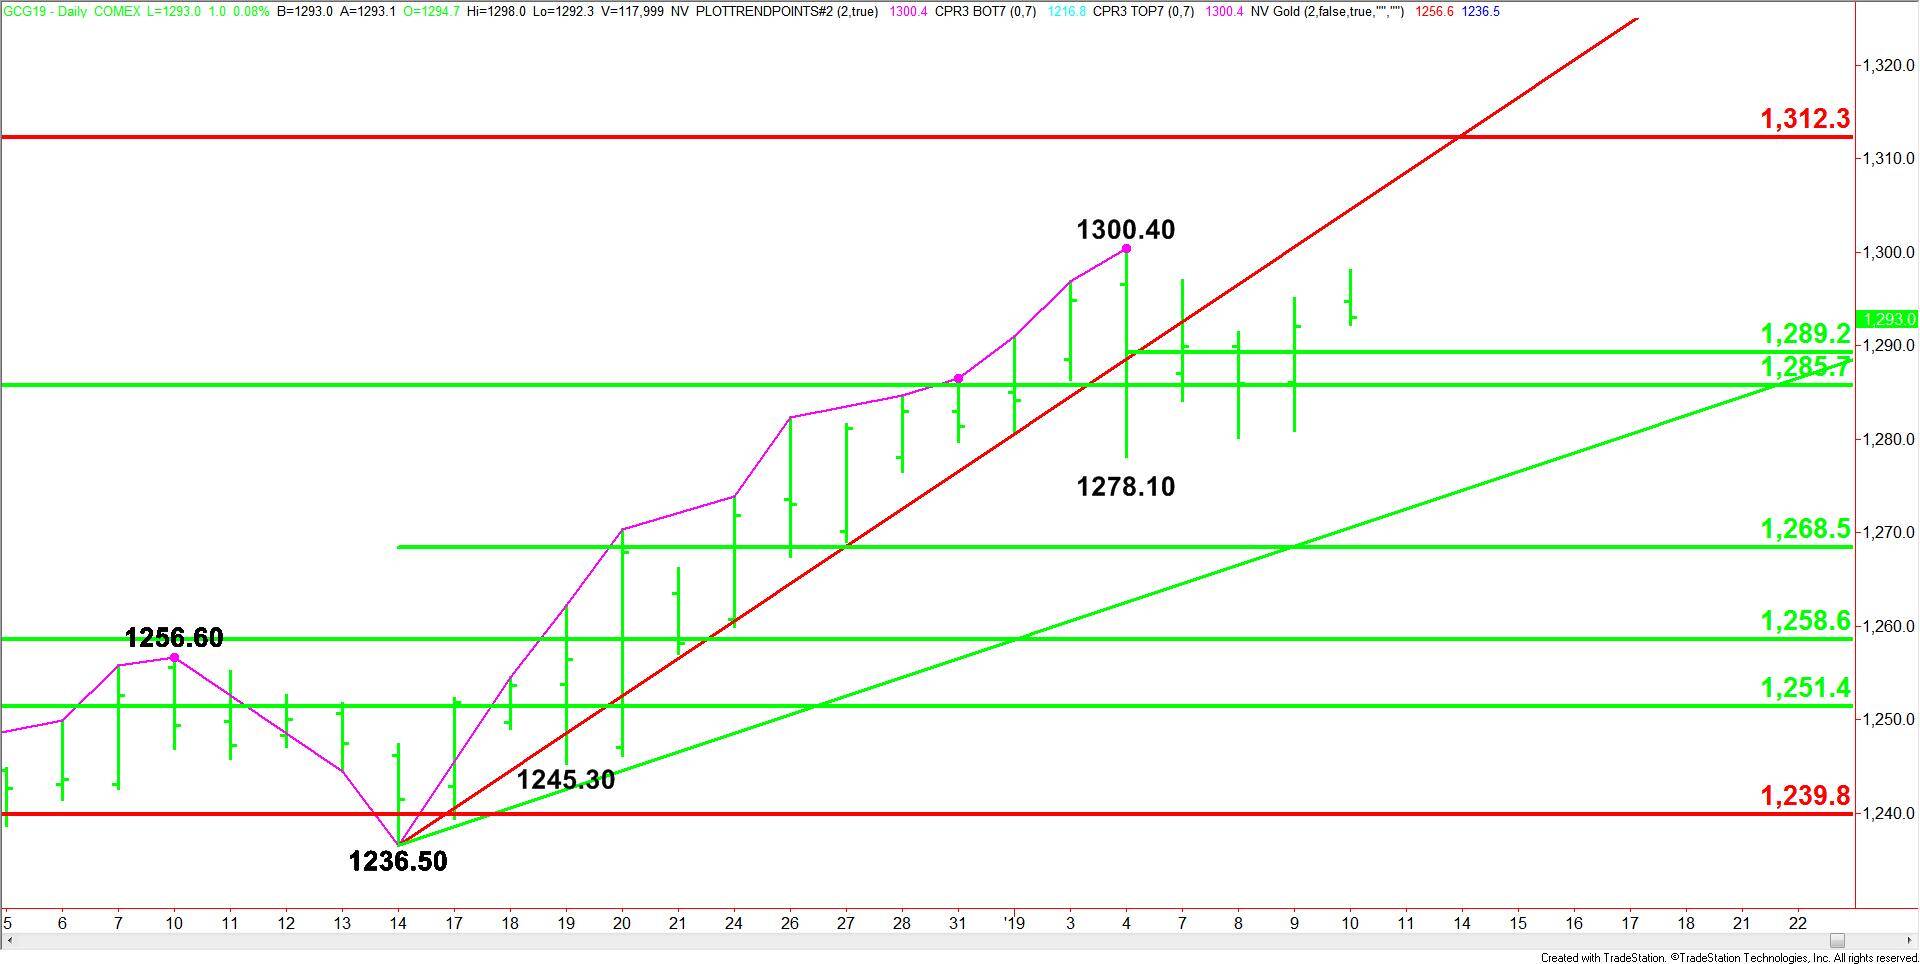
Tough call today with the market trading inside last Friday’s range at $1278.10 to $1300.40 for a fourth day. It looks as if traders are respecting its pivot at $1289.20.

Gold is trading slightly higher shortly after the regular session opening, but giving back its earlier gains. There was some follow-through to the upside earlier in the session following yesterday’s strong rebound rally. However, upside momentum dried up when the U.S. Dollar firmed. Traders are also watching the direction of U.S. Treasury yields and appetite for risk.
At 1335 GMT, February Comex gold futures are trading $1293.00, up $1.00 or +0.07%.
Volume and volatility are a little tight so far this session. This could be position-squaring ahead of a speech by Fed Chair Jerome Powell at 1745 GMT. At this time, the primary focus for traders will be on the direction of the U.S. Dollar.
Daily Technical Analysis
The main trend is up according to the daily swing chart. However, the closing price reversal top from January 4 is still helping to hold the market in a range.
A trade through $1300.40 will signal a resumption of the uptrend. A move through $1278.10 will confirm the closing price reversal top. This could trigger the start of a 2 to 3 day counter-trend break.
The extreme short-term range is $1278.10 to $1300.40. Its 50% level or pivot at $1289.20 could be controlling the market.
The major retracement zone resistance is $1285.70 to $1312.30. This zone is currently stopping the upside momentum.
The short-term range is $1236.50 to $1300.40. Its 50% level target is $1268.50.
Daily Technical Forecast
Tough call today with the market trading inside last Friday’s range at $1278.10 to $1300.40 for a fourth day. It looks as if traders are respecting its pivot at $1289.20.
Bullish Scenario
A sustained move over $1289.20 will indicate the presence of buyers. If this generates enough upside momentum then buyers may take a run at $1300.40, followed by an uptrending Gann angle at $1304.50. Overcoming this angle will put gold in an extremely bullish position. This could lead to a test of the major Fibonacci level at $1312.30.
Bearish Scenario
If $1289.20 fails as support then look for the selling to extend into the major 50% level at $1285.70. This is a potential trigger point for an acceleration to the downside with $1278.10 the next major target.
Sellers really need to take out $1278.10 in order to generate any major downside reaction. Two targets come in at $1270.50 and $1278.50.
About the Author
James Hyerczykauthor
James is a Florida-based technical analyst, market researcher, educator and trader with 35+ years of experience. He is an expert in the area of patterns, price and time analysis as it applies to futures, Forex, and stocks.
Did you find this article useful?
Latest news and analysis


Advertisement