


Gold/Silver technical highlights:
See where DailyFX analysts see Gold heading into year-end and the expected drivers in the Q4 Gold Trading Forecast.
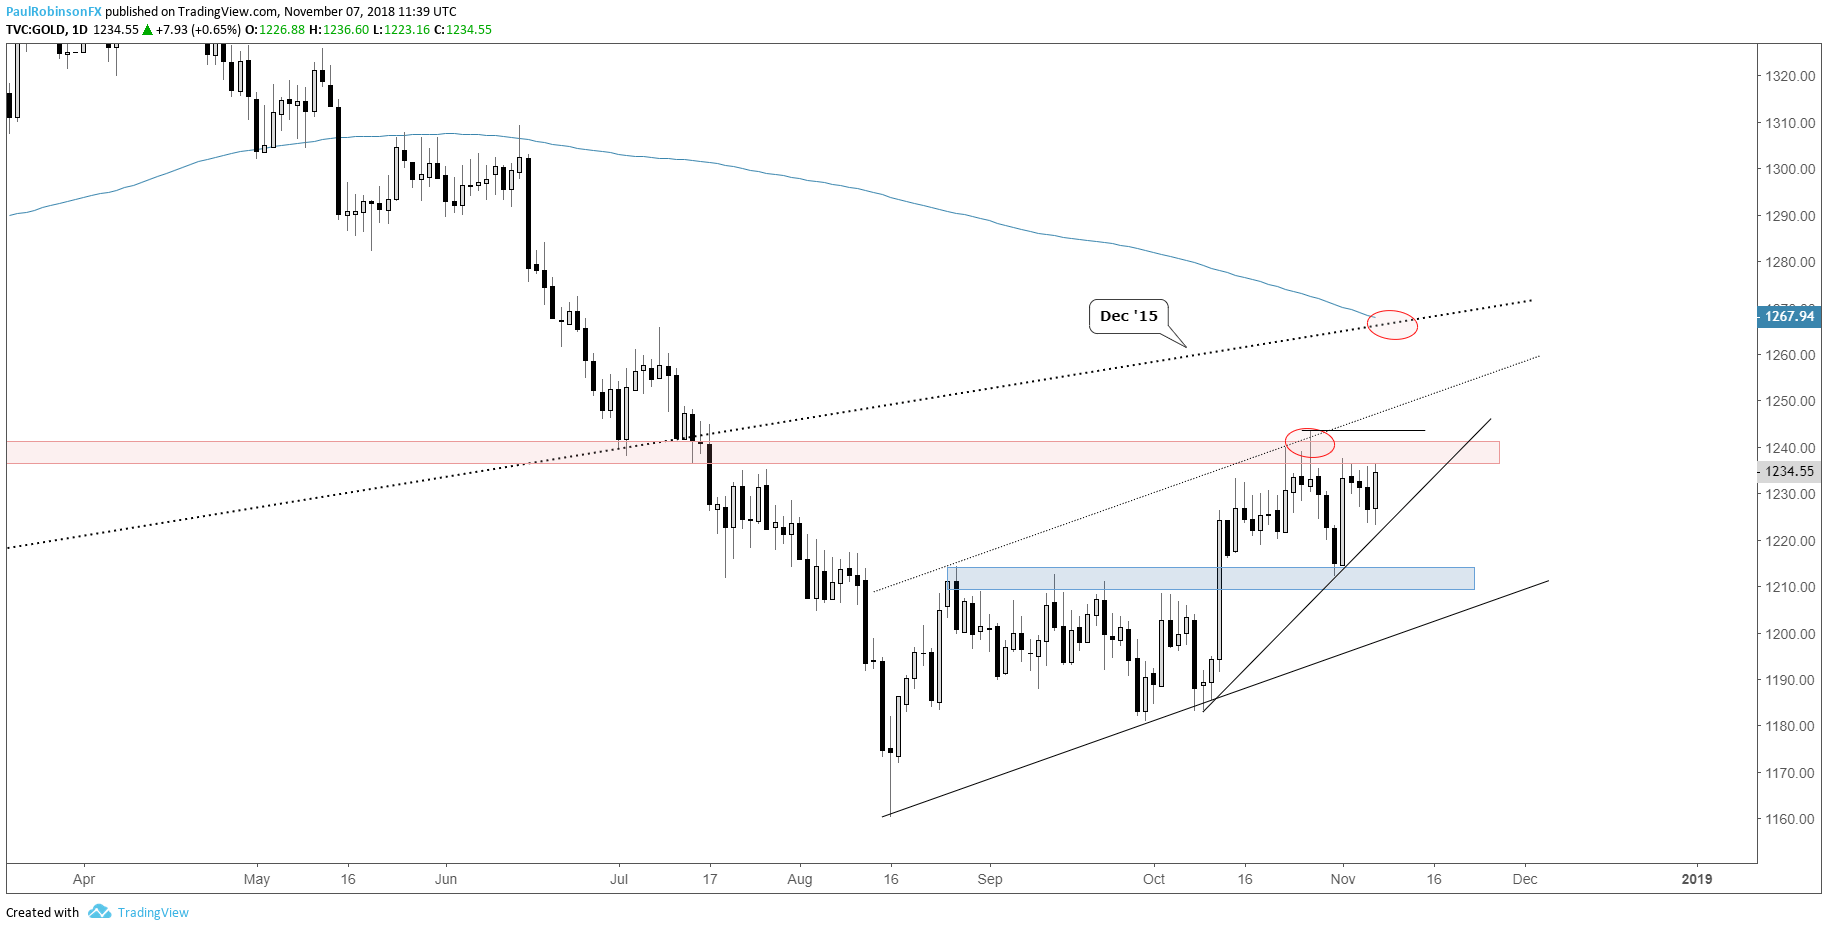
Gold high 1230’s/low-40’s remain a lid (for now)
Gold has been one of the more difficult markets to trade since bottoming in August, with almost all of its price action dominated by range-bound activity. During the most recent round of chop gold is starting to show positive signs that it may want to break higher fairly soon.
The area from around 1237 up to 1243 arrives as resistance from December and a minor low in July. The reversal bar on 10/26 was proof that sellers are in the area, but the strong recovery after the dip once again has gold knocking on the door.
The trend-line extending up from a month-ago should help keep in a floor. Before a breakout can take shape a little more squeezing between resistance and the trend-line may work gold into a somewhat defined wedge that may make for an even more explosive move.
The general trend off the August low is higher, albeit not the cleanest. Nonetheless, this helps tilt the chart higher and keeps some pressure on the top-side. A breakout above 1243 will have gold quickly running into the upper parallel of the channel off the August trough, but given it runs in the direction of the trend it may not act as a significant ceiling. With some ‘oomph’ gold may be able to test the underside of the December 2015 trend-line and 200-day at some point.
Gold traders still remain quite long, check out IG Client Sentiment for details as to how this may be a headwind for the precious metal.
Gold Daily Chart (resistance may not last much longer)
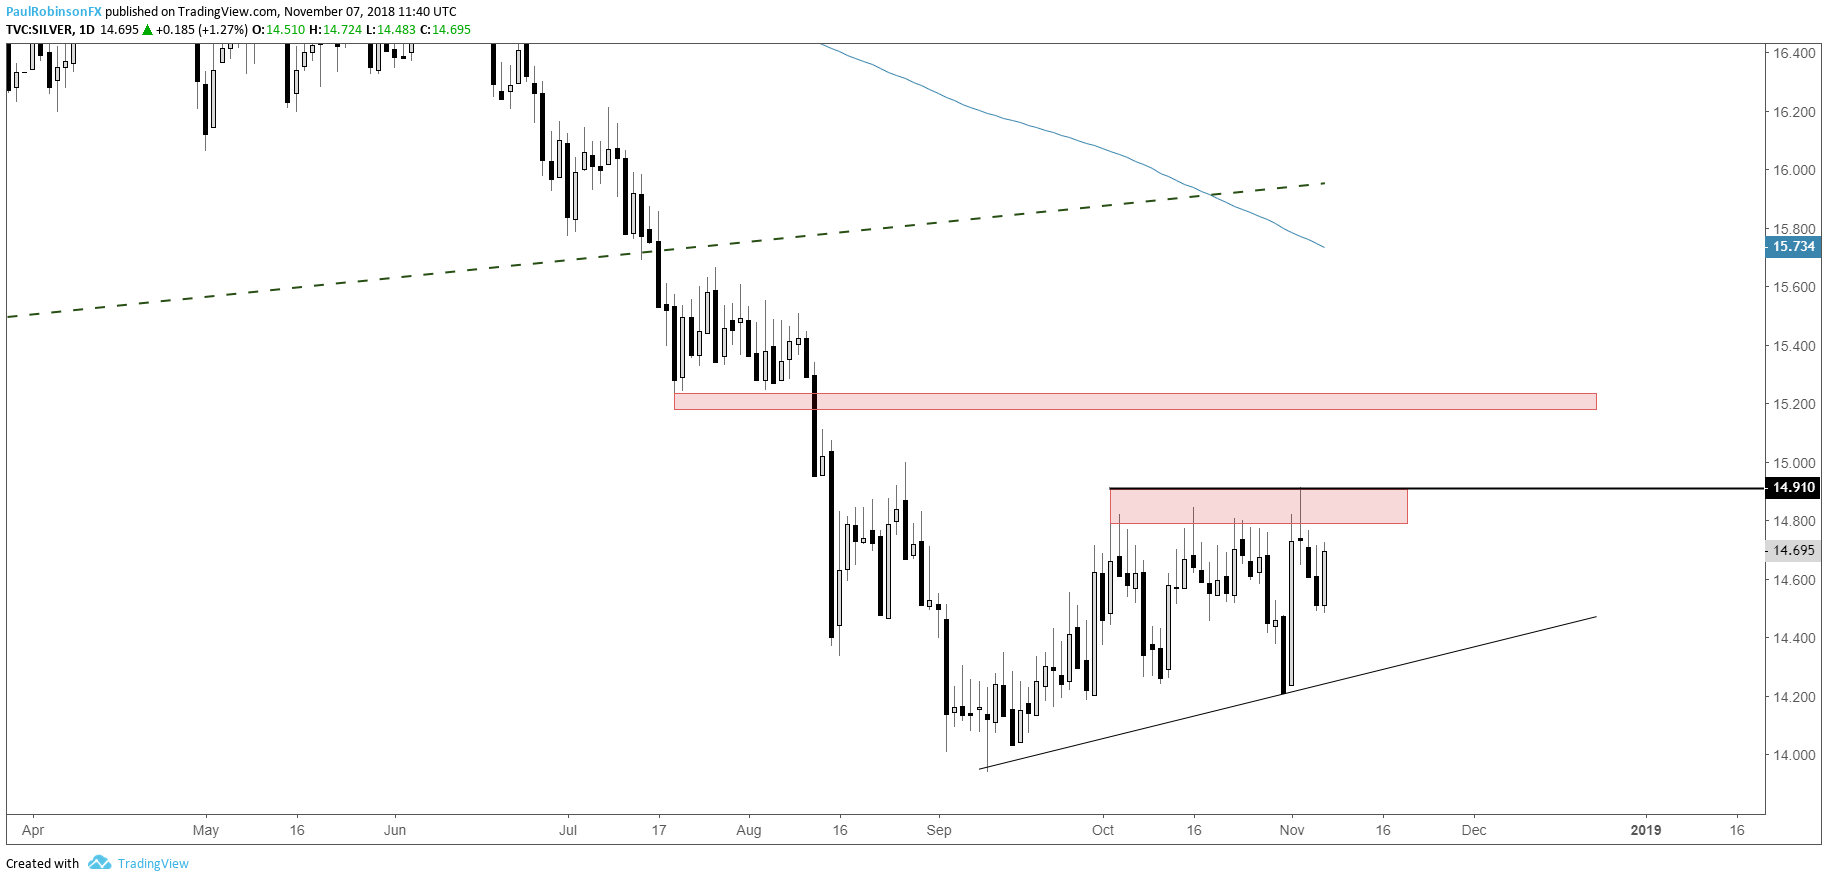
Silver has a clear hurdle to watch
Last week silver looked headed for another leg lower, but with the sudden rebound to start the month that notion was at the least put on the backburner. To get silver going it will need to clearly cross above several highs put in place over the past month, with the uppermost of the resistance zone clocking in at 14.91. This level was first created on 10/2, then touched to the penny on 11/2.
A sustained move above 14.91 should have silver making good on its springboard move higher from last week. The first area of resistance to watch is around 15.20, but given its limited impact in the summer it may have limited impact in stopping silver from advancing.
Silver Daily Chart (Clear resistance to overcome)
Resources for Forex & CFD Traders
Whether you are a new or experienced trader, we have several resources available to help you; indicator for tracking trader sentiment, quarterly trading forecasts, analytical and educational webinars held daily, trading guides to help you improve trading performance, and one specifically for those who are new to forex.
---Written by Paul Robinson, Market Analyst
You can follow Paul on Twitter at @PaulRobinsonFX


