800 Years on the Financial Markets
Have we mentioned, that we love* history**? Probably*** more**** than***** just****** once*******. What we like on the academic studies which use longterm data is that they offer a bird-like view on the financial markets. The daily noise and ebbs and flows retreat into the background and macroeconomic and geopolitical trends emerge. This top-down analysis helps to design the asset allocation or shape the overall structure of the portfolio of systematic trading strategies that may then trade on the higher frequency. Bryan Taylor’s paper offers a treasure of tables and charts depicting over 800 years of history of returns of global stocks, bonds and bills.
The accumulation of data on returns over the last centuries enables one to understand how the Equity Risk Premium has changed over time. It is apparent now that there is no constant risk premium offered by equities (and never was) as ERP changes over time and differs wildly between historical eras, countries, and sectors. Over time, the return to stocks changes more than the return to bonds and largely determines the value of the ERP. Even if you calculate multi-decadal averages of the returns to stocks and bonds and thus the ERP, you still get dramatic fluctuations in the ERP over time.
And what is the takeaway? Well, it’s the one some of us probably intuitively feel: There is no point in trying to find “the” Equity Risk Premium. The constant ERP simply does not exist. Instead, the author focuses on the factors that have influenced ERP over time. They found that exogenous factors have caused the ERP to rise and fall according to the financial and economic factors influencing financial markets and the economy.
The paper also offers and interesting breakdown of the past eight centuries of financial markets into five eras and twenty periods and has provided evidence that the return to stocks and bonds and the ERP differ from one period to the next. And we can’t know how long the current era of De-Globalization in financial markets will last. Diversification seems crucial: Do not put all your eggs in one basket, and be prepared for the unexpected. The rich history of the last eight centuries shows that anything can happen if your investment horizon is long enough.
Authors: Bryan Taylor
Title: Five Financial Eras
Link: https://papers.ssrn.com/sol3/papers.cfm?abstract_id=4780659
Abstract:
This paper presents an analysis of financial history over the past eight centuries by breaking the past up into five historical eras and twenty historical periods. There is a pattern of high equity returns being followed by periods of low equity returns that has existed over the past 400 years. Similar patterns at different intervals have been found for fixed income. This process produces different equity risk premia in different periods. The paper presents evidence on the factors that define the beginning and end of each period and why the returns in one period differ from the next. Each period is separated by geopolitical events, such as the end or beginning of a war (1815, 1914, 1945), a stock market bubble (1720, 1929, 2000), a secular low or high in interest rates (1896, 1981, 2020) or similar events. These events signal a change in the zeitgeist of the period and consequently a change in the returns to stocks, bonds, bills and the equity risk premium. For each period, documentation is provided on wars, trade, the government, returns to stocks and bonds, inflation, bear markets, financial crises, interest rates and exchange rates. An understanding of the factors influencing financial eras and periods will improve our understanding of the returns to stocks, bonds and bills and the equity risk premium in the future.
As always, we present several interesting figures and tables:
Notable quotations from the academic research paper:
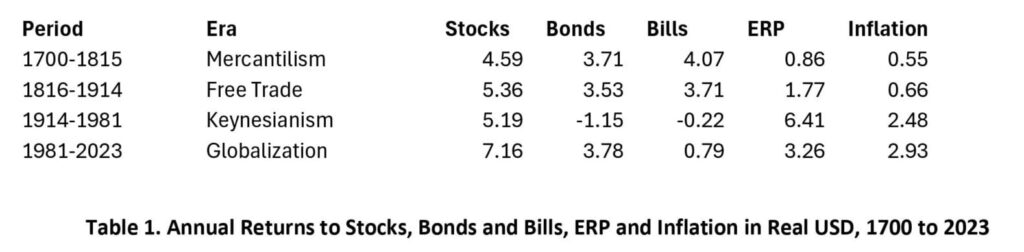
“The returns for each of the most recent four eras to stocks, bonds and bills are provided in Table 1. The return to stocks has risen over time. Returns to stocks are above the average during the current era of Globalization and may revert to the historic mean of around 5% in real terms. The return to bonds was negative during the period of financial repression between 1914 and 1981. The return to bills was negative between 1914 and 1981 and has been low during the period of Globalization. Inflation has been higher since World War I than before.
The goal of this study is to analyze how the Equity Risk Premium has changed over time. In our analysis, financial periods affecting the Equity Risk Premium are shorter than the eras of la longue durée. The zeitgeist usually lasts a generation, around 20 to 25 years, before new events drive the financial economy in a different direction. Usually, the returns to the stock market differ significantly from one period to the next, as do bond yields, returns to fixed income, the equity risk premium, inflation and other financial factors. The start and end dates for a period can be determined by politics, by the economy, by war, by financial factors, or by any other set of variables.
This paper focuses on financial markets. There are significant dates when events occurred that changed the course of financial history and set the tone for the Equity Risk Premium for the next generation. We base the historical periods on the time between these dates. Before the 1600s, there was almost no organized trading of stocks and bonds. Exchanges were set up to buy and sell commodities, or to transfer money between ports in Europe, but there was little trading of financial assets. Although bonds were bought and sold in Venice, Italy and Spain during Medieval times and the Renaissance, there were no organized markets for stocks or bonds.
Nevertheless, there were important turning points in financial history before the 1600s. The primary years that marked different financial periods before the 1600s were 1252 when gold was minted in Italy for the first time since the Roman Empire fell; 1348 when the Black Death struck and transformed the Medieval economy, and 1492 when Columbus discovered America. The discovery of silver and gold in Central Europe and in the Americas initiated the Great Inflation which spread through Europe between the 1520s and the 1620s. Before the 1600s, we can only provide broad outlines of financial periods.
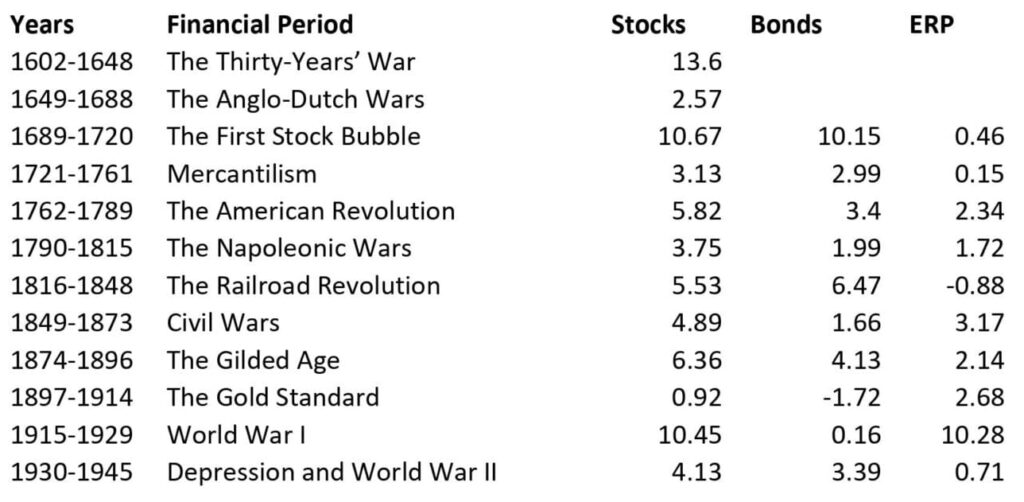
Actual real returns for stocks in the Netherlands between 1602 and 1688, for the United Kingdom between 1689 and 1914 and for the United States since 1914 are provided in Table 5. The table shows that for the most part, the returns follow the predictions of Table 4, providing lower returns in one period followed by higher returns in the next. Some of the contrasts are greater than others, but the patterns, for the most part, are consistent with the model. High returns during one period leads to lower returns in the next as average returns revert to the mean.
The data would predict a higher return to stocks between 2020 and 2040 than between 2000 and 2019 and lower returns to bonds. Given the increase in bond yields during 2021 and 2022, low returns to bonds during the current period because of higher interest rates would be expected. This yields a much higher Equity Risk Premium between 2020 and 2040 than between 2000 and 2019.
There is also a 30-year cycle in stocks. Stocks provided high returns in the 1920s, 1950s, 1980s, and 2010s. The 30-year cycle in stocks produced low returns in the 1910s, 1940s, 1970s, and 2000s. This cycle would predict low returns in the 2030s.
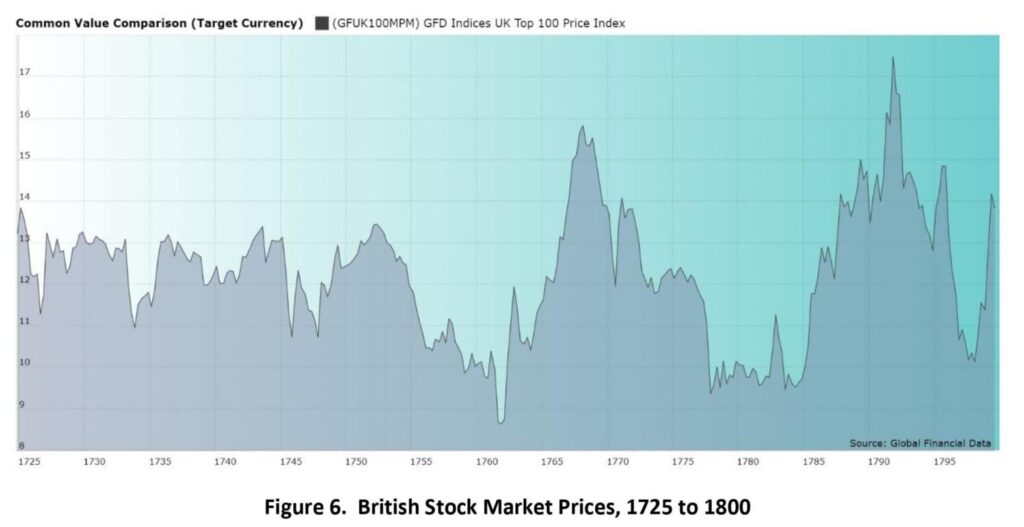
Returns to stocks in the 1700s are illustrated in Figure 6. Stocks lost value during the Seven Years’ War (1756-1763) but rallied once peace returned. Stocks again declined during the American Revolutionary War (1775-1783) but rallied once again when peace returned. A third bear market occurred during the French Revolution and the wars between France and the Allies that followed.
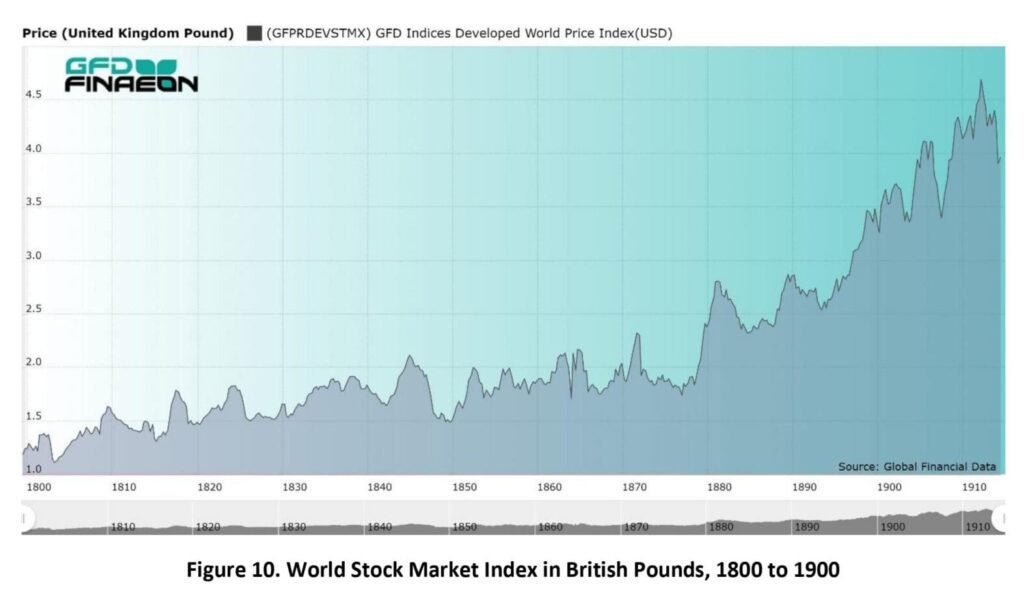
The rise and fall of stocks during the 1800s is illustrated in Figure 10. The bear markets after 1810, 1819 and 1825 are clearly visible. The decline after 1837 led to the railroad mania in the early 1840s which then led to a collapse after 1845. There were minor declines in 1857 and 1864, but the biggest decline occurred after the 1873 collapse of the stock markets in the United States, Germany and Austria. Stock markets barely budged between 1810 and 1875, but stock markets enjoyed a secular bull market after 1873.
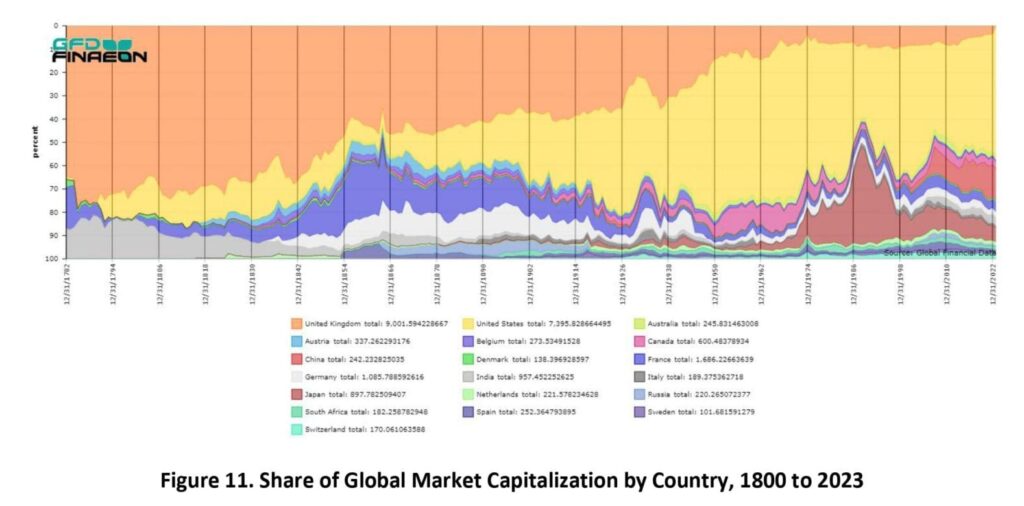
Historical data on stock market capitalization by country as a share of global stock market capitalization is illustrated in Figure 11. The United Kingdom (orange) was the largest country in the world during the 1800s, but gradually declined during the 1900s. The United States (yellow) dominated global stock markets in the twentieth century. After World War II, the United States represented over 70% of the global stock market. France (blue) and Germany (white) were the largest markets in the 1800s after the US and the UK. Japan’s (brown) growth until 1989 and its decline thereafter are also visible.”
Are you looking for more strategies to read about? Sign up for our newsletter or visit our Blog or Screener.
Do you want to learn more about Quantpedia Premium service? Check how Quantpedia works, our mission and Premium pricing offer.
Do you want to learn more about Quantpedia Pro service? Check its description, watch videos, review reporting capabilities and visit our pricing offer.
Are you looking for historical data or backtesting platforms? Check our list of Algo Trading Discounts.
Or follow us on:
Facebook Group, Facebook Page, Twitter, Linkedin, Medium or Youtube
Share onLinkedInTwitterFacebookRefer to a friend