
Advertisement
Advertisement
Gold Price Forecast: Will the Rally Continue?
By:
Gold surged to a new high but encountered resistance, pausing its advance. Key trendlines suggest further upside potential, with the rally likely leading to new record highs.
In this article:
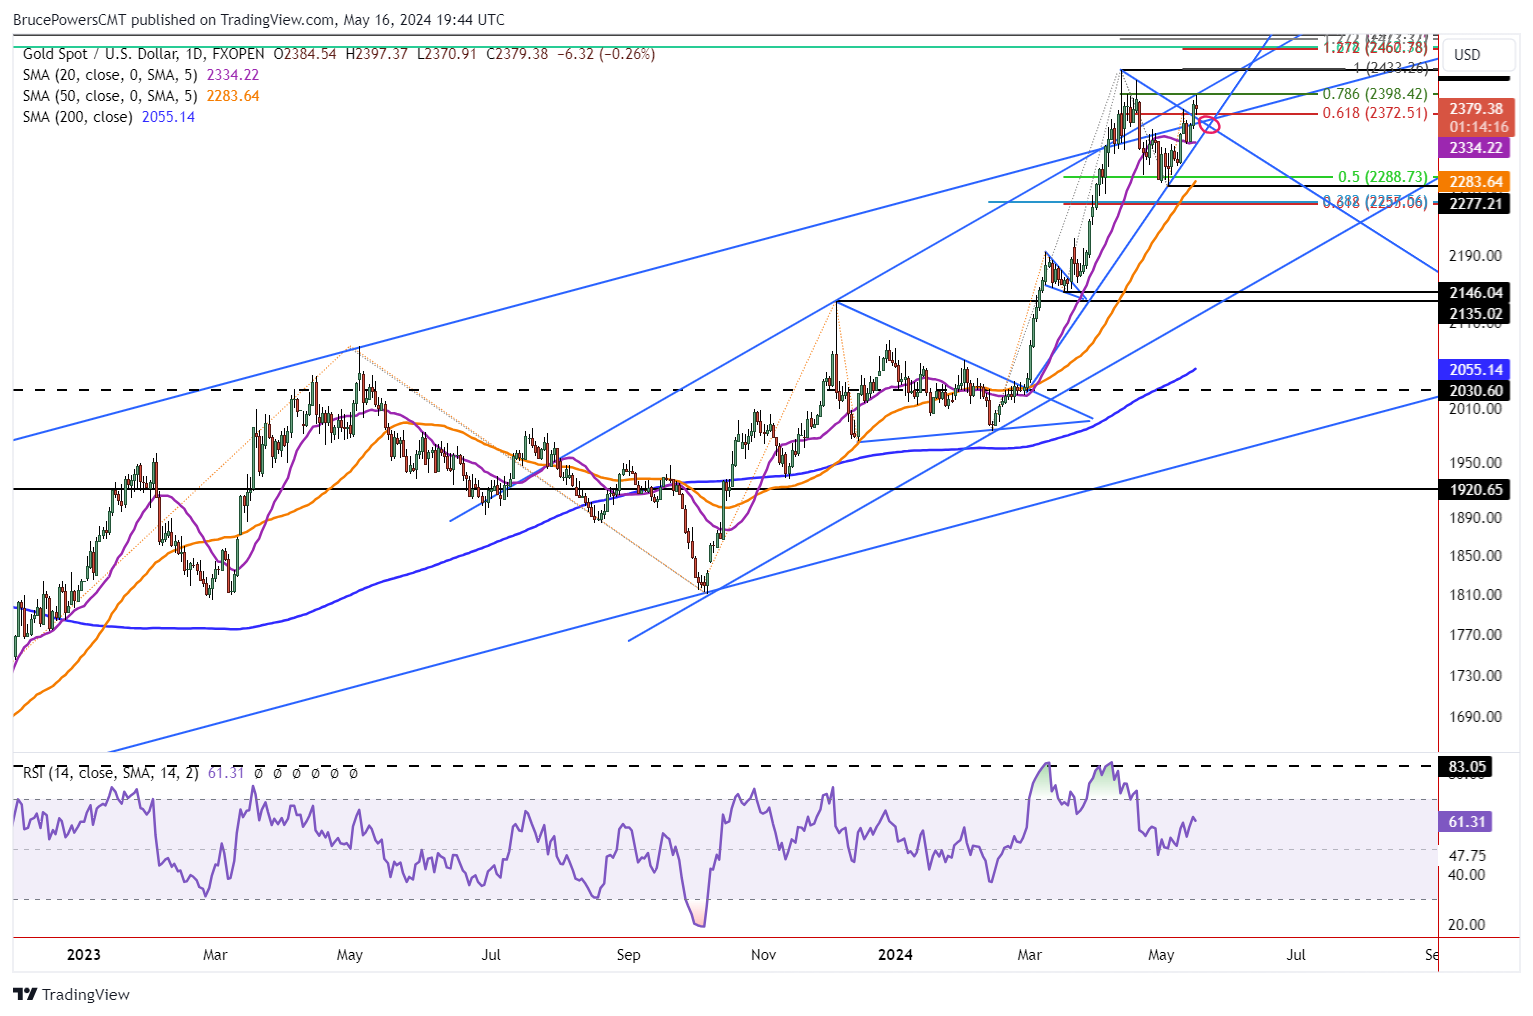
Gold rallied to a new trend high of 2,397 on Thursday before encountering resistance and pulling back intraday. At the time of this writing gold is on track to complete the day with a narrow range, reflecting a pause in the advance. Resistance was seen at the 78.6% Fibonacci retracement and further confirmed by a top rising trend channel line that marked the same price. Support for the day was at 2,371, right at the 61.8% Fibonacci retracement zone (prior resistance becomes support).
Trendlines Indicate Higher Prices for Gold
Of note is the relationship of the price of gold with two trendlines. The more significant line is the rising line connecting the recent May 3 swing low, as it covers a longer time frame than the second line. If gold stays above that line, it can be anticipated to continue to strengthen. Also, gold rose above the downtrend line starting from the April 12 record high of 2,431 yesterday, and it exceeded the prior trend high at 2,378 as well. Wednesday’s close was above both the line and prior trend high thereby confirming strength.
Second Breakout of Trend Channel in Process
Moreover, yesterday’s advance ended clearly above the longer top rising channel line, triggering a second bullish breakout from the parallel trend channel. Will the second breakout lead to upside follow through? Certainly, it is starting to look that way. In addition to the trendlines noted above, the purple 20-Day MA is critical support if a retracement begins. It happens to match the price represented by the rising trendline today at 2,334.
Breakout Above 2,397 Triggers Bullish Continuation
A decisive rally above today’s high of 2,397 provides a bullish signal. If this occurs the record high of 2,431 is the next target. Gold is likely to then continue to advance into new record high territory. The first new high target is around 2,461/2,462, marked by the confluence of two Fibonacci levels. It includes a 161.8% extension at of the retracement from the decline that began off the August 2011 trend high of 1,921. Therefore, it is potentially a significant price level as it covers a long period of time.
For a look at all of today’s economic events, check out our economic calendar.
About the Author
Bruce Powersauthor
Bruce boasts over 20 years in financial markets, holding senior roles such as Head of Trading Strategy at Relentless 13 Capital and Corporate Advisor at Chronos Futures. A CMT® charter holder and MBA in Finance, he's a renowned analyst and media figure, appearing on 150+ TV business shows.
Did you find this article useful?
Latest news and analysis


Advertisement