With the employment situation release, we have a first reading on April conditions.
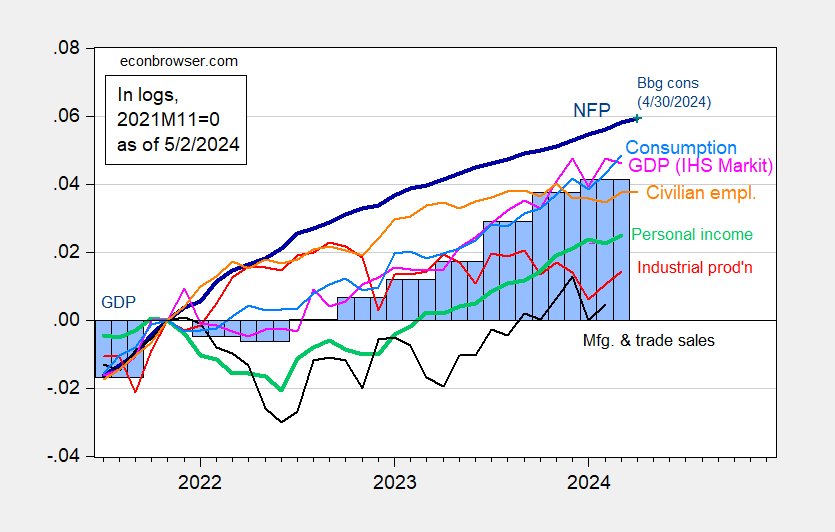
Figure 1: Nonfarm Payroll (NFP) employment from CES (bold blue), civilian employment (orange), industrial production (red), personal income excluding current transfers in Ch.2017$ (bold green), manufacturing and trade sales in Ch.2017$ (black), consumption in Ch.2017$ (light blue), and monthly GDP in Ch.2017$ (pink), GDP, 3rd release (blue bars), all log normalized to 2021M11=0. Source: BLS via FRED, Federal Reserve, BEA 2024Q1 advance release, S&P Global Market Insights (nee Macroeconomic Advisers, IHS Markit) (5/1/2024 release), and author’s calculations.
Average net job growth is 242 thousand vs. 276 thousand as of March (pre-revision). Annualized m/m monthly GDP growth drops from pre-revision 11.5% in February to -1.9% in March.
The bond market has taken the employment release details as a whole as indicating a deceleration (relative to pre-release). Yields have dropped, while futures indicate a higher likelihood of drops in Fed funds come September FOMC meeting.
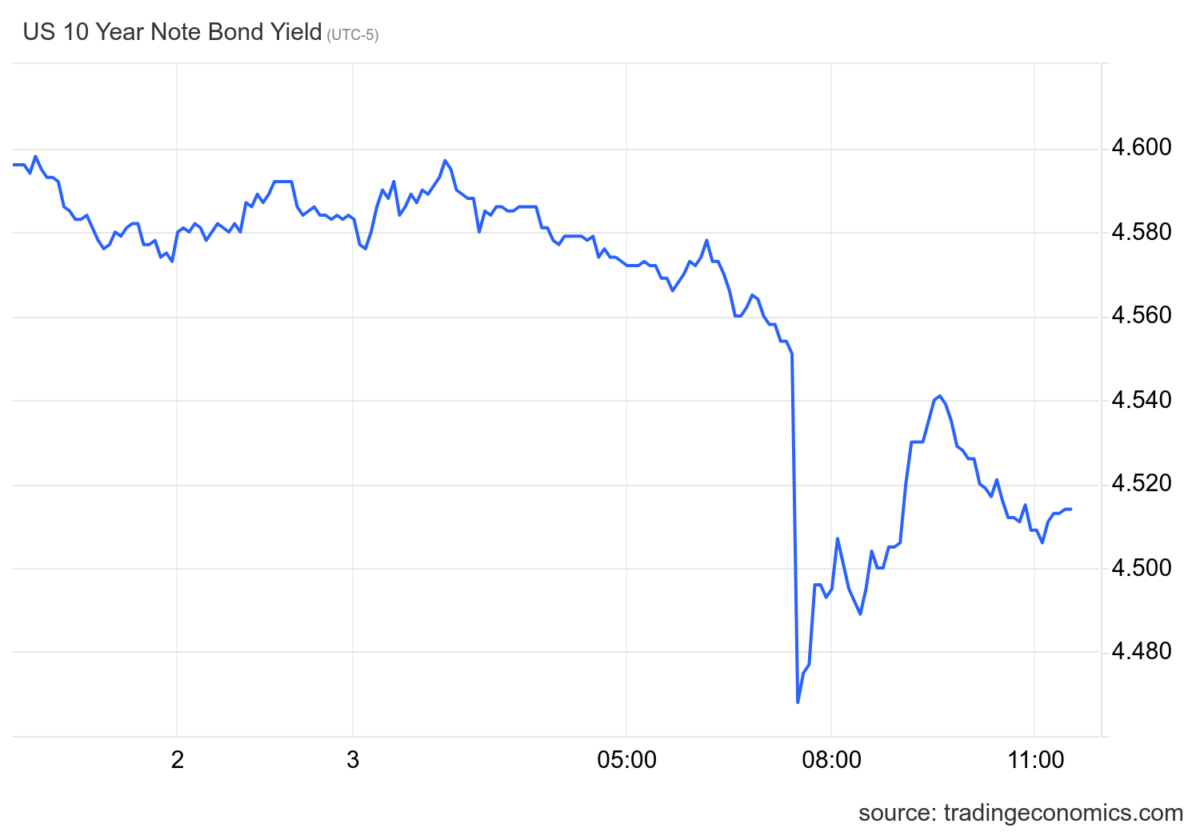
Source: TradingEconomics, accessed 5/3/2024. Times are Central.
Collapsing 17 job categories to 10 summary categories, forecasts may not be too far off from reported data.
In my case, the net error of 9 categories, was -2K. The big error was nonfederal government employees, I was off by 54K.
What seems difficult for future forecasts is that dlog(nonfederal) shows a correlogram that seems to show random changes for the monthly changes for the period 2020M10 to 2024M04.
Using the forecast of (dlog(nonfederal) c) does not seem very satisfying. I wonder if the slow-down in nonfederal government hiring is due to budget difficulties for cities, counties and states.
Category*********************** Forecast Error(k), over (under) forecast:
1 US goods production***********USGOOD *************-4
2 Transportation and utilities******* USTPU ************-16
3 Information services************* USINFO **********1
4 Financial activities*************** USFIRE *********-5
5 Professional and business services* USPBS *********19
6 Education and health services***** USEHS *********-9
7 Leisure and hospitality*********** USLAH *********11
8 Other services****************** USSERV **********0
9 Federal employees ********************Fed************0
Net error for categories 1 through 10******************************-2
10 Non-federal government employees NonFed *********54
Total net error 54-2 = 52K
Net -2K error should be for categories 1 through 9, not categories 1 through 10.
AS, the % increase in state employment before seasonal adjustment in Q4 was the biggest for any quarter since Q4 2015. Prior to Covid, big gains in Q4 (NSA) were followed by declines in the other three quarters. Since Covid arrived, that pattern is less reliable. We’ve just had a strong Q4 and a not weak Q1. Three thoughts: A) Does your forecasting method tend to project strength after strength, an autocorrelation thingie? and; 2) Maybe gains to state employment have been front-loaded and there was less need to hire in April; Finally) Give revisions a chance.
https://fred.stlouisfed.org/graph/?g=1mFNa
Any of these three things could account for a one-time forecasting miss for this category. The three could, in fact, be related.
You may be right about budgets but along with revenue problems (which tend to be dealt with in new budgets instead of mid-budget), Covid-related programs could be running out. Budgets produce regularities, while Covid and Covid-related programs tend to produce irregularities.
MD,
Thanks for the comments.
Using seasonally adjusted values, below are the monthly percent changes in nonfederal government employment. The percent change in April 2024 was significantly lower than the prior months percent changes. The monthly mean percentage change from 2023m01 to 2024m04 is 0.25%. The sample standard deviation is 0.10%. As shown, the percent change from 2024m03 to 2024m04 was 0.03%.
The dlog(nonfederal) series is stationary for the period 2021m08 to 2024m04. What makes forecasting difficult for this data series, is that the monthly percent changes from 2021m08 to 2024m04 appears to be random. The only way I know of forecasting a random series, if the original data are not a trend, is to use the following model: dlog(nonfederal) c. Using this model, I get a forecasted change of 36K for May 2024. I don’t have a lot of confidence in this forecast for May, given the April data.
2023M01 *0.60
2023M02 *0.26
2023M03 *0.24
2023M04 *0.20
2023M05 *0.22
2023M06 *0.25
2023M07 *0.14
2023M08 *0.25
2023M09 *0.22
2023M10 *0.30
2023M11 *0.15
2023M12 *0.33
2024M01 *0.23
2024M02 *0.24
2024M03 *0.31
2024M04 *0.03
Using seasonally adjusted values, below are the monthly employment changes from 2023m01 to 2024m04. The mean number of job additions from 2023m01 to 2024m04 is 49K and the sample standard deviation is 6K.
2023M01 *117
2023M02 *51
2023M03 *47
2023M04 *39
2023M05 *43
2023M06 *49
2023M07 *28
2023M08 *49
2023M09 *44
2023M10 *59
2023M11 *31
2023M12 *67
2024M01 *47
2024M02 *48
2024M03 *62
2024M04 **6
The SD of the monthly change data should say 23, not 6. My eye inadvertently picked up the April 2024 data instead of the SD.
Maybe have a go at using NSA data, then apply seasonal factors to the NSA forecast? I doub it would do any better, but it’s worth a shot.
MD,
Thanks for the thoughts.
My understanding is that forecasters interested in forecasting seasonality adjusted data use seasonality adjusted data. It is quite a process to convert NSA data into SA data.
In the past I consulted with a professional forecaster who confirmed the comment about using SA data if one is interested in forecasting SA data. The professional forecaster contributes to the Fed. Reserve Bank of Philadelphia forecasts.
As I said, I’m not a all sure NSA data would help. But you have a specific problem with a specific series. Rules of thumb aren’t always reliable for specific problems.
I think I recall correctly that Rudolph Kalman objected to the use of SA data when applying filters because seasonal adjustment is, itself, a filter. Courses for horses, as the Brits would say.
I often take a quick look at NSA data just to know how large swing are in a particular period. Big swings mean big adjustments, allowing the adjustment factor to introduce large swings. Any time there is a shock that interrupts seasonal patters, this can be quit useful in understanding what’s going on with a data series.
Steven Kopits has recently tried to tell us how people cannot afford to buy houses with his “evidence” being a claim that “mortgage originations” are at their lowest level in 30 years. Now Stevie at first provided no data (typical) so I did. My series was total mortgage originations which noted Stevie got this wrong too (no srprise).
Now Stevie copied and pasted some Bill McBride graph which was a weird little index. Stevie forgot to tell us McBride included this in an interesting post where McBride never made the bogus claim Stevie made. Again – no surprise.
But let’s try this:
https://fred.stlouisfed.org/series/PRFIC1
Real Private Residential Fixed Investment
Residential investment did fall a bit from a very high peak but has been increasing over the past two quarters.
So what was Stevie’s little point again? Oh yea – Stevie tells a lot of pointless lies. Got it!
MD,
I am not certain I can forecast nsa data and then properly translate back into sa data, but you gave me an idea. In the past, I forecasted federal and nonfederal employment. I was unaware of the state employment series. So, I can now forecast, federal, state and city-county employment. Federal employment barely changes each month except during census years.
For the month of April 2024, federal employment changed by 2K, state employment changed by 6K, and city-county employment was flat. A preliminary thought is that federal employment may change by 2K for May, state employment may change by 9K, and city-county employment may be flat again. The changes in federal and state employment data are not white noise, but the changes in the city-county data are white noise. Below are charts of the change data for federal, state and city-county employment.
D(federal employees)
https://fred.stlouisfed.org/graph/?g=1nghd
D(state employees)
https://fred.stlouisfed.org/graph/?g=1ng63
D(city and county employees)
https://fred.stlouisfed.org/graph/?g=1ng7N