
Advertisement
Advertisement
Gold Price Forecast: Testing Support After Bearish Breakdown
By:
Gold faces resistance at previous lows, with a potential downtrend continuing towards key support levels around 2,261 to 2,255.
In this article:
Earlier in Wednesday’s session gold fell briefly below Monday’s low of 2,285 before finding support around 2,282 and bouncing. A bearish breakdown from a flag pattern triggered yesterday with gold closing below an earlier swing low at 2,291 thereby confirming the breakdown. It remains to be seen whether gold can hold on to today’s advance, which has tested Monday’s low as resistance.
The breakdown trigger for the bear flag was also at that low. This is typical behavior in a bearish environment. As the price of gold begins to trend down prior support levels are tested as resistance. Unless there is an advance above Tuesday’s high of 2,236 the retracement is anticipated to continue.
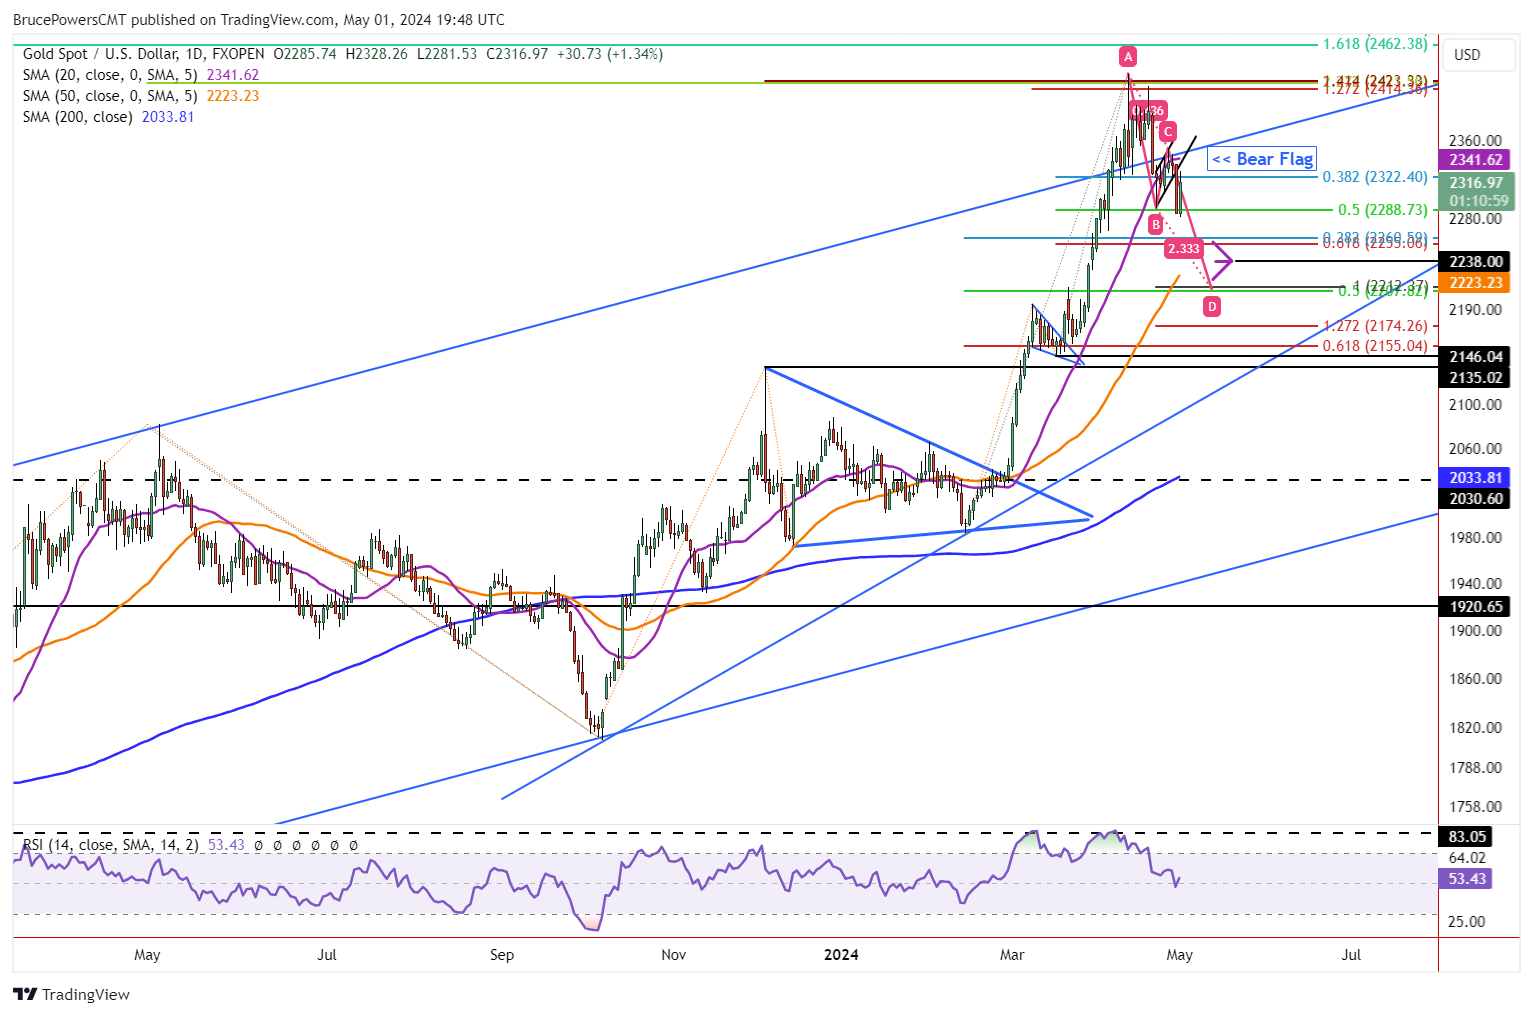
Next Lower Target Zone Starts at 2,261
A 50% retracement has already been completed opening the door to the next lower support zone. That looks to be around 2,261 to 2,255, where there is confluence of two Fibonacci retracement levels. An initial conservative target from the bear flag is calculated around 2,238. Given the sharp drop following the breakdown trigger (Monday’s low) it seems like there is a good chance it may eventually be reached.
50-Day Moving Average May Yet be Tested as Support
Nevertheless, further down is a more significant area of interest. It starts with the 50-Day MA, now at 2,232. A range from two Fibonacci levels subsequently occurs from 2,212 to 2,208. It includes the 50% retracement of the full swing from the February lows and the completion of a falling ABCD pattern. Therefore, there is a realistic possibility that gold eventually tests this potential support zone before it is ready to proceed higher.
Bearish Close for April
Nonetheless, last month’s support of 2,228. If broken to the downside it would be a sign of weakening. The significance will depend on the follow through. Either a quick recovery back above April’s low or a deeper pullback. April closed relatively weak, in the lower half of the month’s trading range, ending with a bearish shooting star pattern. However, as noted above, the 50-Day MA and Fibonacci support zone on the daily chart is below last month’s low. This would imply that a drop through April’s low may quickly encounter signs of support.
For a look at all of today’s economic events, check out our economic calendar.
About the Author
Bruce Powersauthor
Bruce boasts over 20 years in financial markets, holding senior roles such as Head of Trading Strategy at Relentless 13 Capital and Corporate Advisor at Chronos Futures. A CMT® charter holder and MBA in Finance, he's a renowned analyst and media figure, appearing on 150+ TV business shows.
Did you find this article useful?
Latest news and analysis


Advertisement